Dashboard
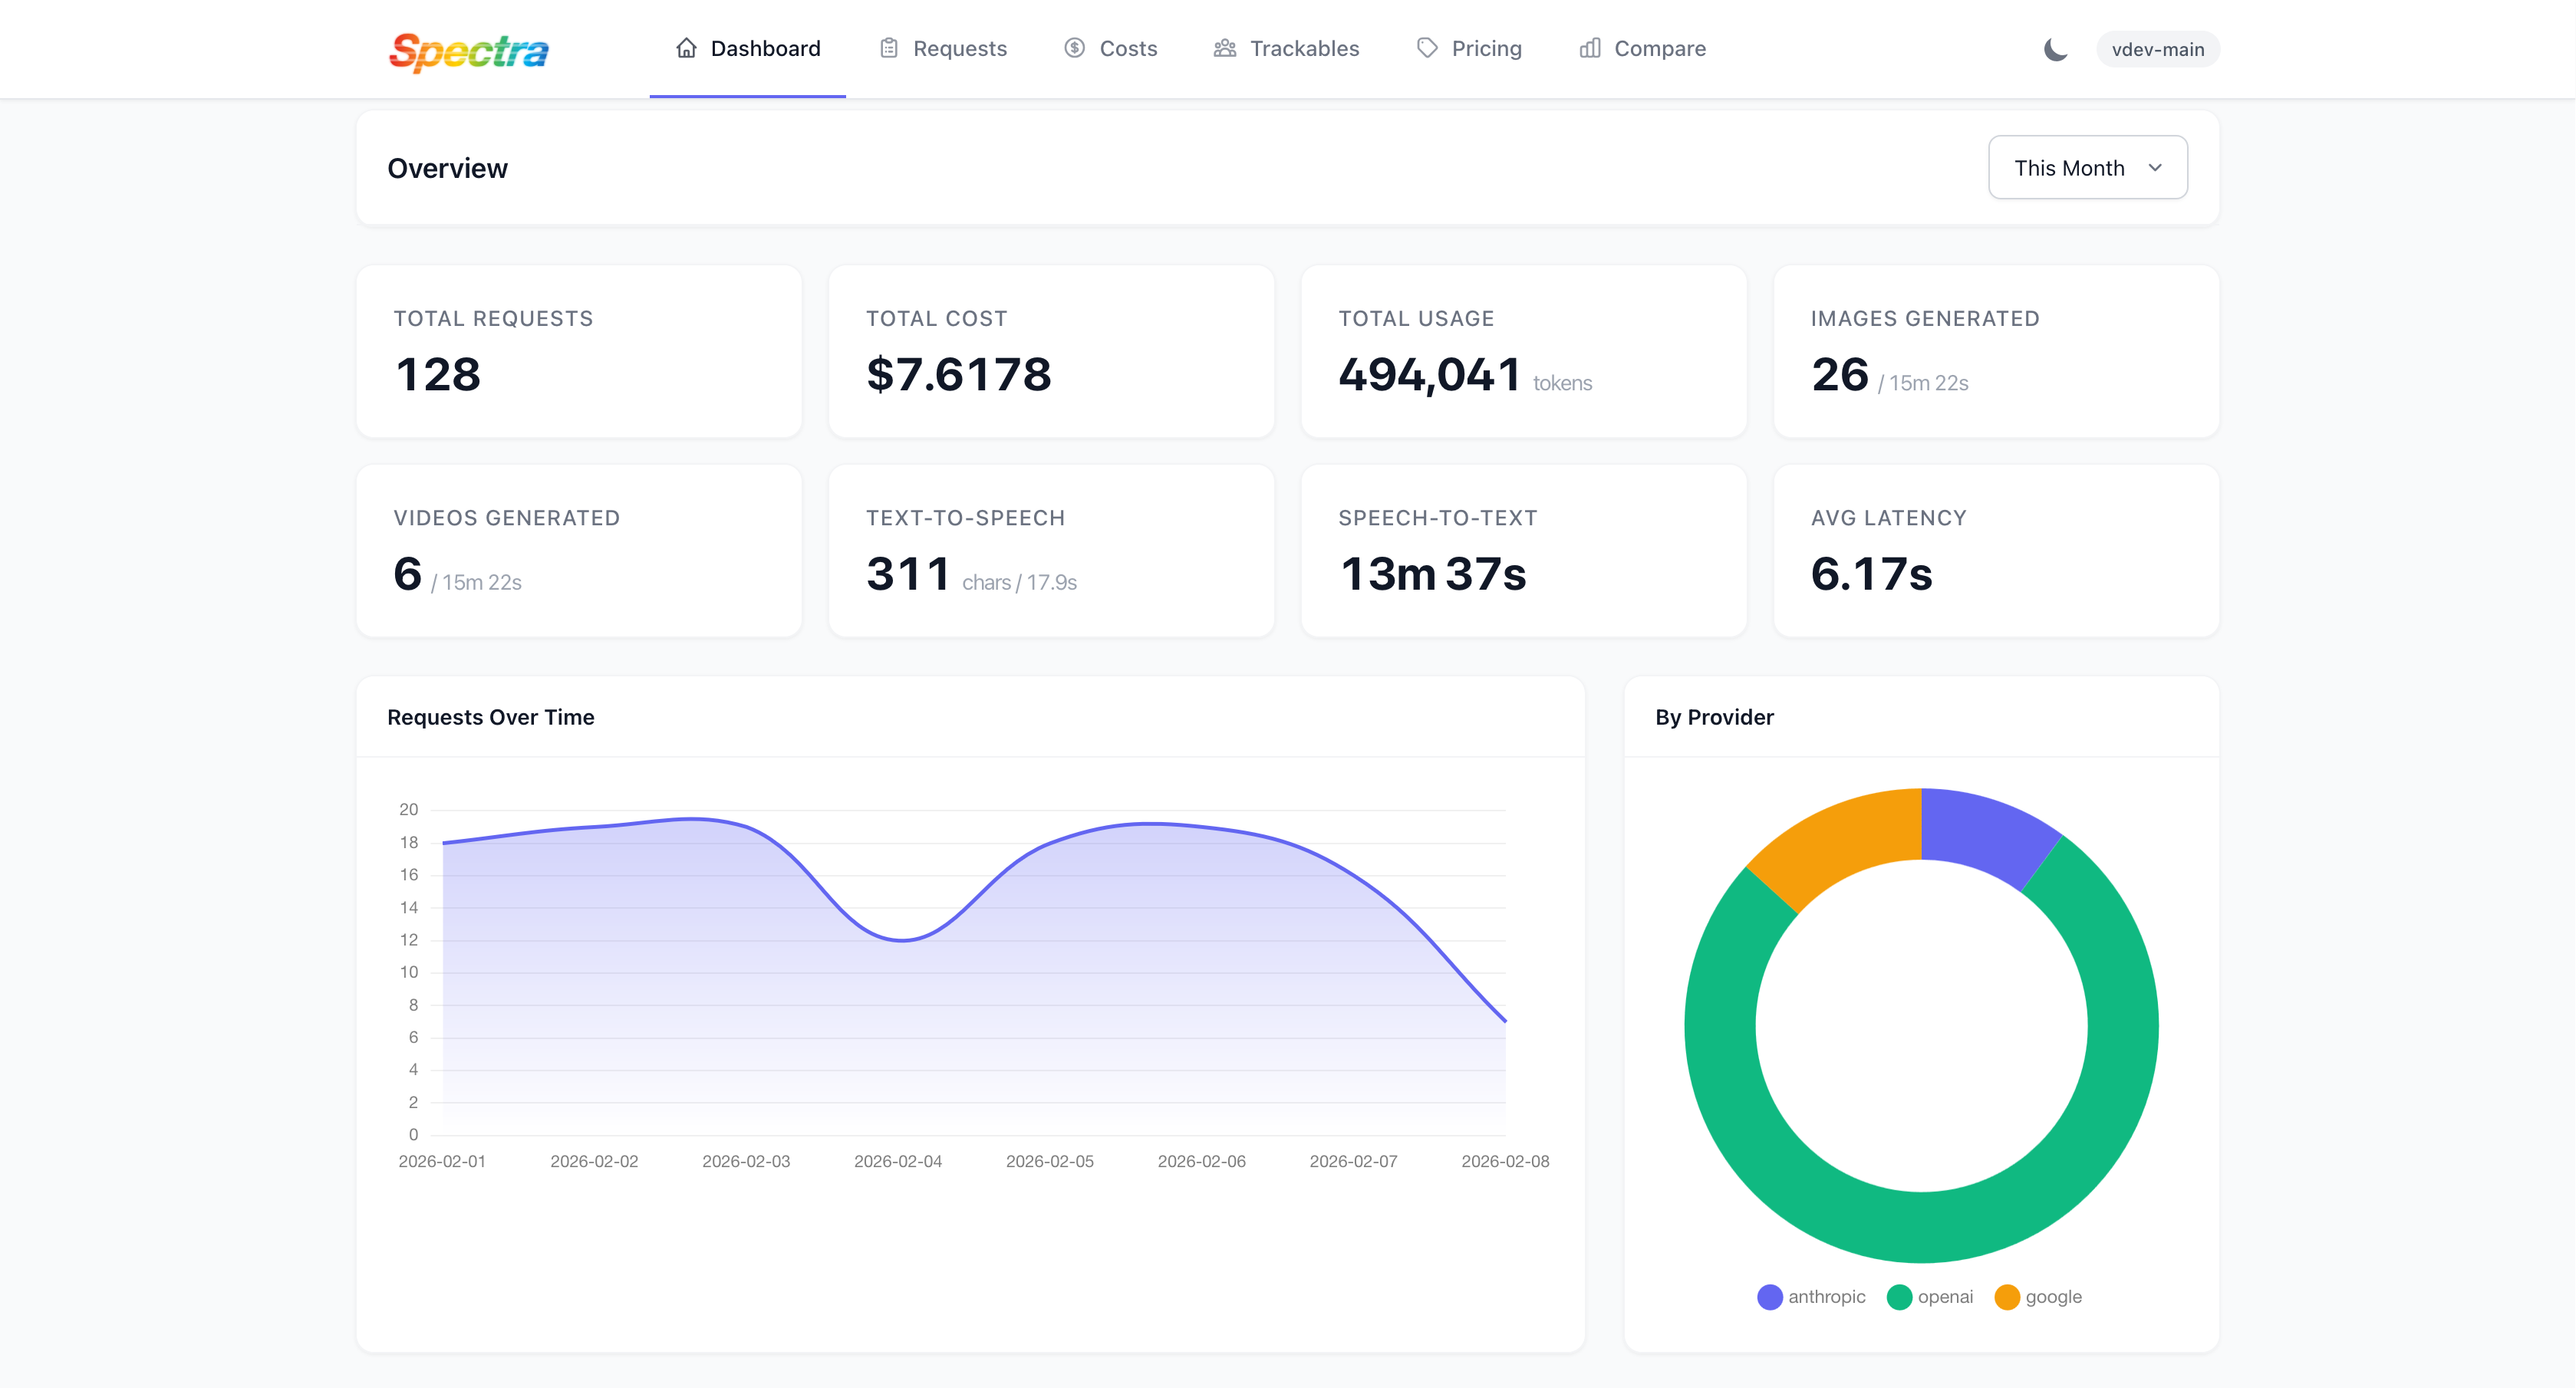
Spectra includes a built-in single-page application (SPA) dashboard for exploring AI request data, analyzing costs, managing the pricing catalog, and viewing per-user analytics. The dashboard is served directly from your Laravel application and requires no separate frontend build or deployment.
Accessing the Dashboard
By default, the dashboard is available at /spectra on your application's domain. The path, domain, and middleware are all configurable in config/spectra.php:
'dashboard' => [
    'domain' => null,                    // Optional subdomain (e.g., 'spectra')
    'enabled' => true,
    'path' => env('SPECTRA_PATH', 'spectra'),
    'middleware' => ['web'],             // Add 'auth' for authentication
    'layout' => 'full',                  // Display mode
    'date_format' => 'M j, Y g:i:s A',
],
Authorization
Dashboard access is controlled by the viewSpectra gate. By default, only the local environment is permitted. To allow access in production or staging environments, define the gate in a service provider:
Gate::define('viewSpectra', function ($user) {
    return $user->isAdmin();
});
If your application provides Spectra security via another method, such as IP restrictions or a VPN, you may need to change the closure signature to function ($user = null) to allow unauthenticated access to the gate check.
Screens
Requests
The main request explorer displays all tracked AI requests in a paginated, filterable list. Each row shows the provider with its display name and logo, the model used, token usage, calculated cost, latency, and HTTP status code. You can filter the list by provider, model, HTTP status, custom tags, trace ID, and date range. This screen is the primary interface for investigating individual AI operations and understanding usage patterns.
Request Detail
Clicking any request in the explorer opens the detail view, which provides a comprehensive breakdown of the request:
- Overview — Provider, model, model type, token counts, cost, latency, and status at a glance.
- Request payload — The full JSON body sent to the AI provider, including messages, parameters, and tool definitions.
- Response payload — The full JSON response with the AI's generated output.
- Code frames — The file and line number where the request originated in your application code, making it easy to trace an AI call back to its source.
- Tags and metadata — Any custom tags or context attached to the request.
- Media — Generated images or videos, if media persistence is enabled.
Cost Analysis
The cost analysis screen provides a breakdown of AI spending across providers, models, and time periods. You can view total spend by provider, cost per model, and spending trends over time. This screen helps you identify which models and features are driving the most cost and spot unexpected spending patterns.
Cost Comparison
The cost comparison tool lets you evaluate "what-if" scenarios by comparing your current model usage against alternative models. You can see what you are spending now, what you would spend with a different model at the same usage levels, and identify potential savings by switching models. This is particularly useful for optimizing costs across your AI operations.
Pricing Management
The pricing management screen lets you view and edit the pricing catalog directly in the dashboard. You can browse all providers and their models, view per-tier prices (standard, batch, flex, priority), edit prices inline, add new models to a provider, delete models you no longer need, and clear the pricing cache. Changes take effect immediately without requiring a deployment.
Providers
The providers screen shows all configured providers with their associated models, model snapshots, and operational status.
Trackables
The trackables screen provides per-user or per-entity analytics. You can see which users are making the most requests, view cost breakdowns per user, and drill into a specific user's request history. This is valuable for understanding usage distribution across your user base and identifying heavy consumers.
Layout Modes
The dashboard.layout configuration option controls which model types are displayed in the dashboard. This is useful if your application only uses a subset of model types and you want a focused view:
| Layout | Shows |
|---|---|
full | All model types with a type distribution chart |
text | Text completions only |
embedding | Embeddings only |
image | Image generation only |
video | Video generation only |
audio | TTS and STT metrics |
API Endpoints
All dashboard data is served through JSON API endpoints under /{spectra-path}/api/. These endpoints are protected by the same viewSpectra gate and can be used to build custom dashboards or integrate Spectra data into other tools.
Analytics
| Method | Endpoint | Description |
|---|---|---|
| GET | /api/config | Dashboard configuration and feature flags |
| GET | /api/stats | Aggregated usage statistics across all dimensions |
| GET | /api/costs | Cost breakdown by provider, model, and time period |
| GET | /api/cost-comparison | Model cost comparison data for what-if analysis |
Requests
| Method | Endpoint | Description |
|---|---|---|
| GET | /api/requests | Paginated request list with full filter support |
| GET | /api/requests/{id} | Single request detail with payloads and metadata |
| GET | /api/requests/{id}/video | Download a generated video file |
| GET | /api/tags | All available tags for filter dropdowns |
Trackables
| Method | Endpoint | Description |
|---|---|---|
| GET | /api/trackables | List all tracked users and entities with usage summaries |
| GET | /api/trackables/view/{id} | Detailed analytics for a specific entity |
Providers and Models
| Method | Endpoint | Description |
|---|---|---|
| GET | /api/providers | Provider list with logos and metadata |
| GET | /api/models | Model list grouped by provider and type |
Pricing Management
| Method | Endpoint | Description |
|---|---|---|
| GET | /api/pricing | Full pricing catalog with all tiers |
| POST | /api/pricing/models/{id} | Update pricing for a specific model |
| PATCH | /api/pricing/models/{id} | Update model metadata |
| DELETE | /api/pricing/models/{id} | Delete a model from the catalog |
| POST | /api/pricing/providers/{name}/models | Add a new model to a provider |
| POST | /api/pricing/cache/clear | Clear the pricing cache |
Disabling the Dashboard
To run Spectra in headless mode — tracking requests and calculating costs without serving the dashboard UI — disable it in the configuration:
'dashboard' => [
    'enabled' => false,
],
Or via environment variable:
SPECTRA_DASHBOARD_ENABLED=falseWhen the dashboard is disabled, all tracking, cost calculation, and API functionality continues to work. Only the web routes and UI assets are not registered.