Alerts
Alerts tell you when your AI traffic goes wrong while you're not looking at the dashboard: the error rate climbs, responses get slow, or spend spikes. An alert rule is a sentence like "tell me when more than 10% of calls failed in the last 15 minutes". You write the rules in config/spectra.php; php artisan spectra:check-alerts checks them against the stored calls and notifies you by email, Slack or a webhook.
Budgets limit what one user or team may spend. Alerts watch your whole app (or one provider or model) for problems.
Writing Rules
Each rule watches one metric over a window of recent minutes, and fires when the metric goes above or below its threshold:
// config/spectra.php
'alerts' => [
    'rules' => [
        ['name' => 'High error rate', 'metric' => 'error_rate', 'above' => 0.1, 'window' => 15],
        ['name' => 'Slow OpenAI', 'metric' => 'latency_p95', 'above' => 20000, 'provider' => 'openai'],
        ['name' => 'Spend spike', 'metric' => 'cost', 'above' => 5000, 'window' => 60],
        ['name' => 'Chat is down', 'metric' => 'requests', 'below' => 1, 'window' => 30, 'model' => 'gpt-5.4'],
    ],
],| Metric | Measures | Unit |
|---|---|---|
error_rate | The share of failed calls (no 2xx status, or an error on a 2xx answer) | 0 to 1 (0.1 is 10%) |
latency_p95 | How long successful calls take at the 95th percentile: 95 of every 100 calls finished within this time. It ignores the few slowest calls, so one outlier doesn't fire it | milliseconds |
latency_avg | The average latency of successful calls | milliseconds |
cost | The spend of successful calls | cents (5000 is $50) |
requests | The number of calls | calls |
| Key | Default | |
|---|---|---|
name | Shown in notifications and on the dashboard. Each rule needs its own. | |
metric | One of the metrics above. | |
above / below | The threshold. Give exactly one. | |
window | 15 | How many minutes of calls the metric is measured over, ending now: 15 means the last 15 minutes. |
min_requests | 10 | For error_rate and the latencies: the calls the window needs before the rule is judged, so one failure out of two calls doesn't fire a 50% error rate. |
provider, model | all | Narrow the rule to one provider or one model. |
A rule with a typo (an unknown metric, no threshold) makes spectra:check-alerts fail with a message saying what is wrong, and the dashboard's Alerts card shows the message.
Checking the Rules
Schedule the command every few minutes:
// routes/console.php
use Illuminate\Support\Facades\Schedule;

Schedule::command('spectra:check-alerts')->everyFiveMinutes();
Run it by hand to see every rule's value now:
php artisan spectra:check-alertsA rule that breaks its threshold notifies once. While it keeps firing, it notifies again every cooldown minutes (default 60, SPECTRA_ALERTS_COOLDOWN). When it recovers, it notifies once more that it is resolved. Each rule's state is kept in your cache store, so the check can run on any server.
Notifications
'alerts' => [
    'notify' => [
        'mail' => env('SPECTRA_ALERTS_MAIL'),                           // "ops@example.com, cto@example.com"
        'slack_webhook_url' => env('SPECTRA_ALERTS_SLACK_WEBHOOK_URL'), // a Slack incoming webhook
        'webhook_url' => env('SPECTRA_ALERTS_WEBHOOK_URL'),             // any URL that takes a JSON POST
    ],
],
Email goes through your app's mailer. The webhook receives:
{
    "alert": "High error rate",
    "status": "firing",
    "metric": "error_rate",
    "value": 0.235,
    "threshold": 0.1,
    "condition": "above",
    "window_minutes": 15,
    "provider": null,
    "model": null,
    "dashboard_url": "https://example.com/spectra"
}
status is resolved when the rule recovers. A channel that fails goes to your exception handler; the others still send.
Events
Every firing dispatches Spectra\Events\AlertTriggered, and every recovery Spectra\Events\AlertResolved, with the rule and its value. Listen to them to page someone, open an incident, or switch to a fallback model:
use Spectra\Events\AlertTriggered;

Event::listen(function (AlertTriggered $event) {
    if ($event->rule->provider === 'openai') {
        Cache::put('ai.fallback-provider', 'anthropic', now()->addHour());
    }
});
On the Dashboard
The Overview shows an Alerts card with each rule, its value now, and whether it is firing as of the last spectra:check-alerts:

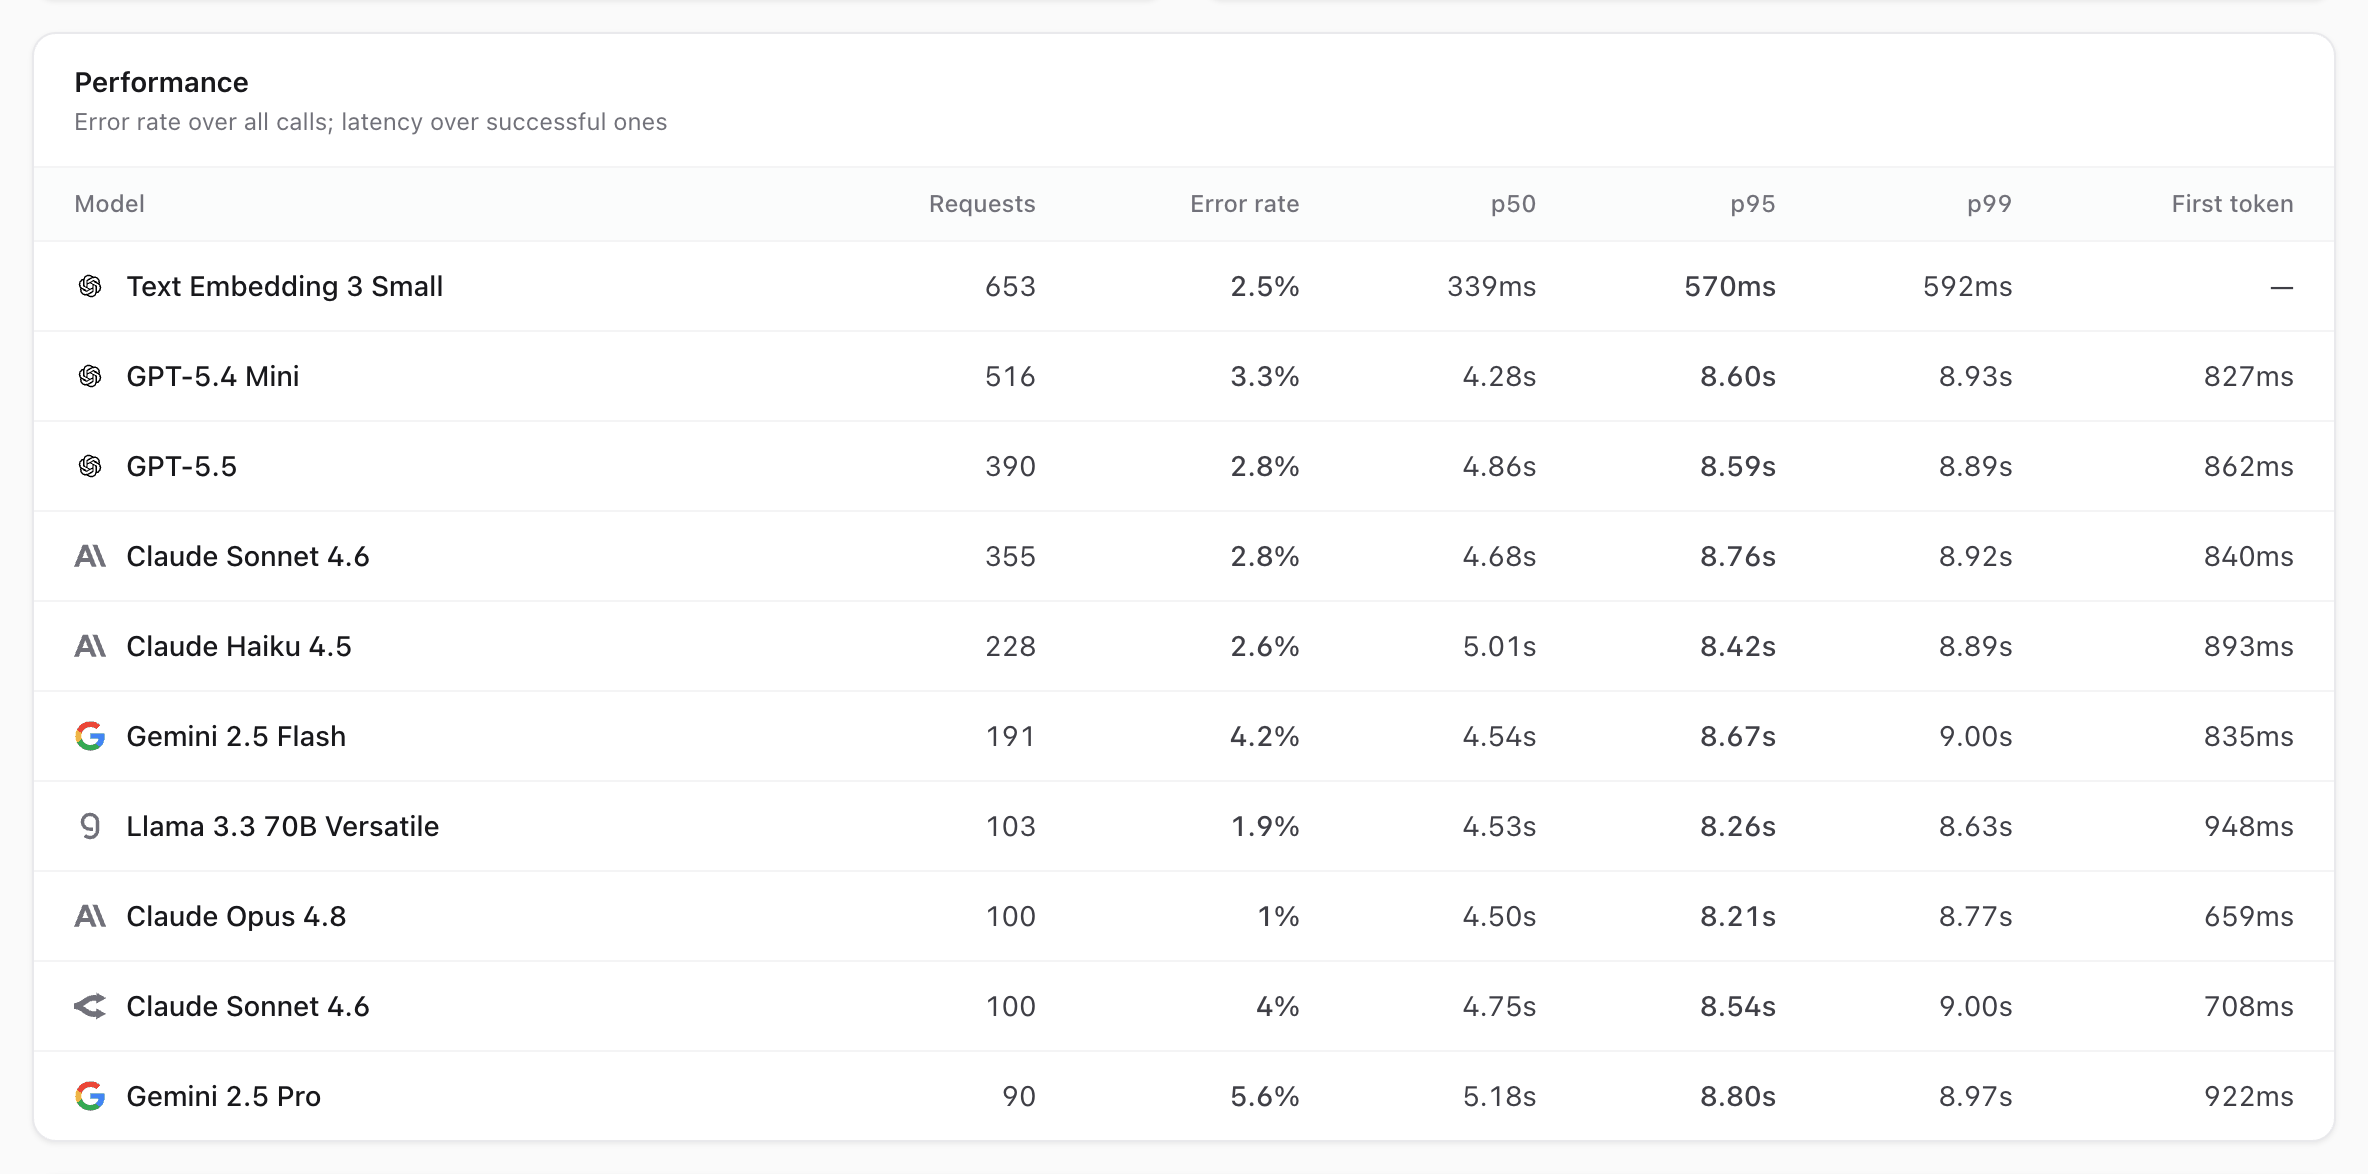
Below it, the Performance card shows each model's error rate and its p50, p95 and p99 latency for the selected period: the time within which 50, 95 and 99 of every 100 calls finished. See Dashboard.