
Dashboard
Spectra ships with a dashboard for exploring your AI traffic. It lives at /spectra and, by default, opens only in the local environment. To open it elsewhere, define the viewSpectra gate (see Dashboard Authorization). To change its path, middleware or layout, see Configuration.
The screens are in the sidebar on the left; the arrows at its bottom collapse it to icons, and the dashboard remembers your choice in the browser. The top bar holds the actions: pause and resume recording, refresh the screen, the Review screen, the Maintenance screen, and dark mode. Pausing shows only to users the manageSpectra gate allows (see Maintenance).
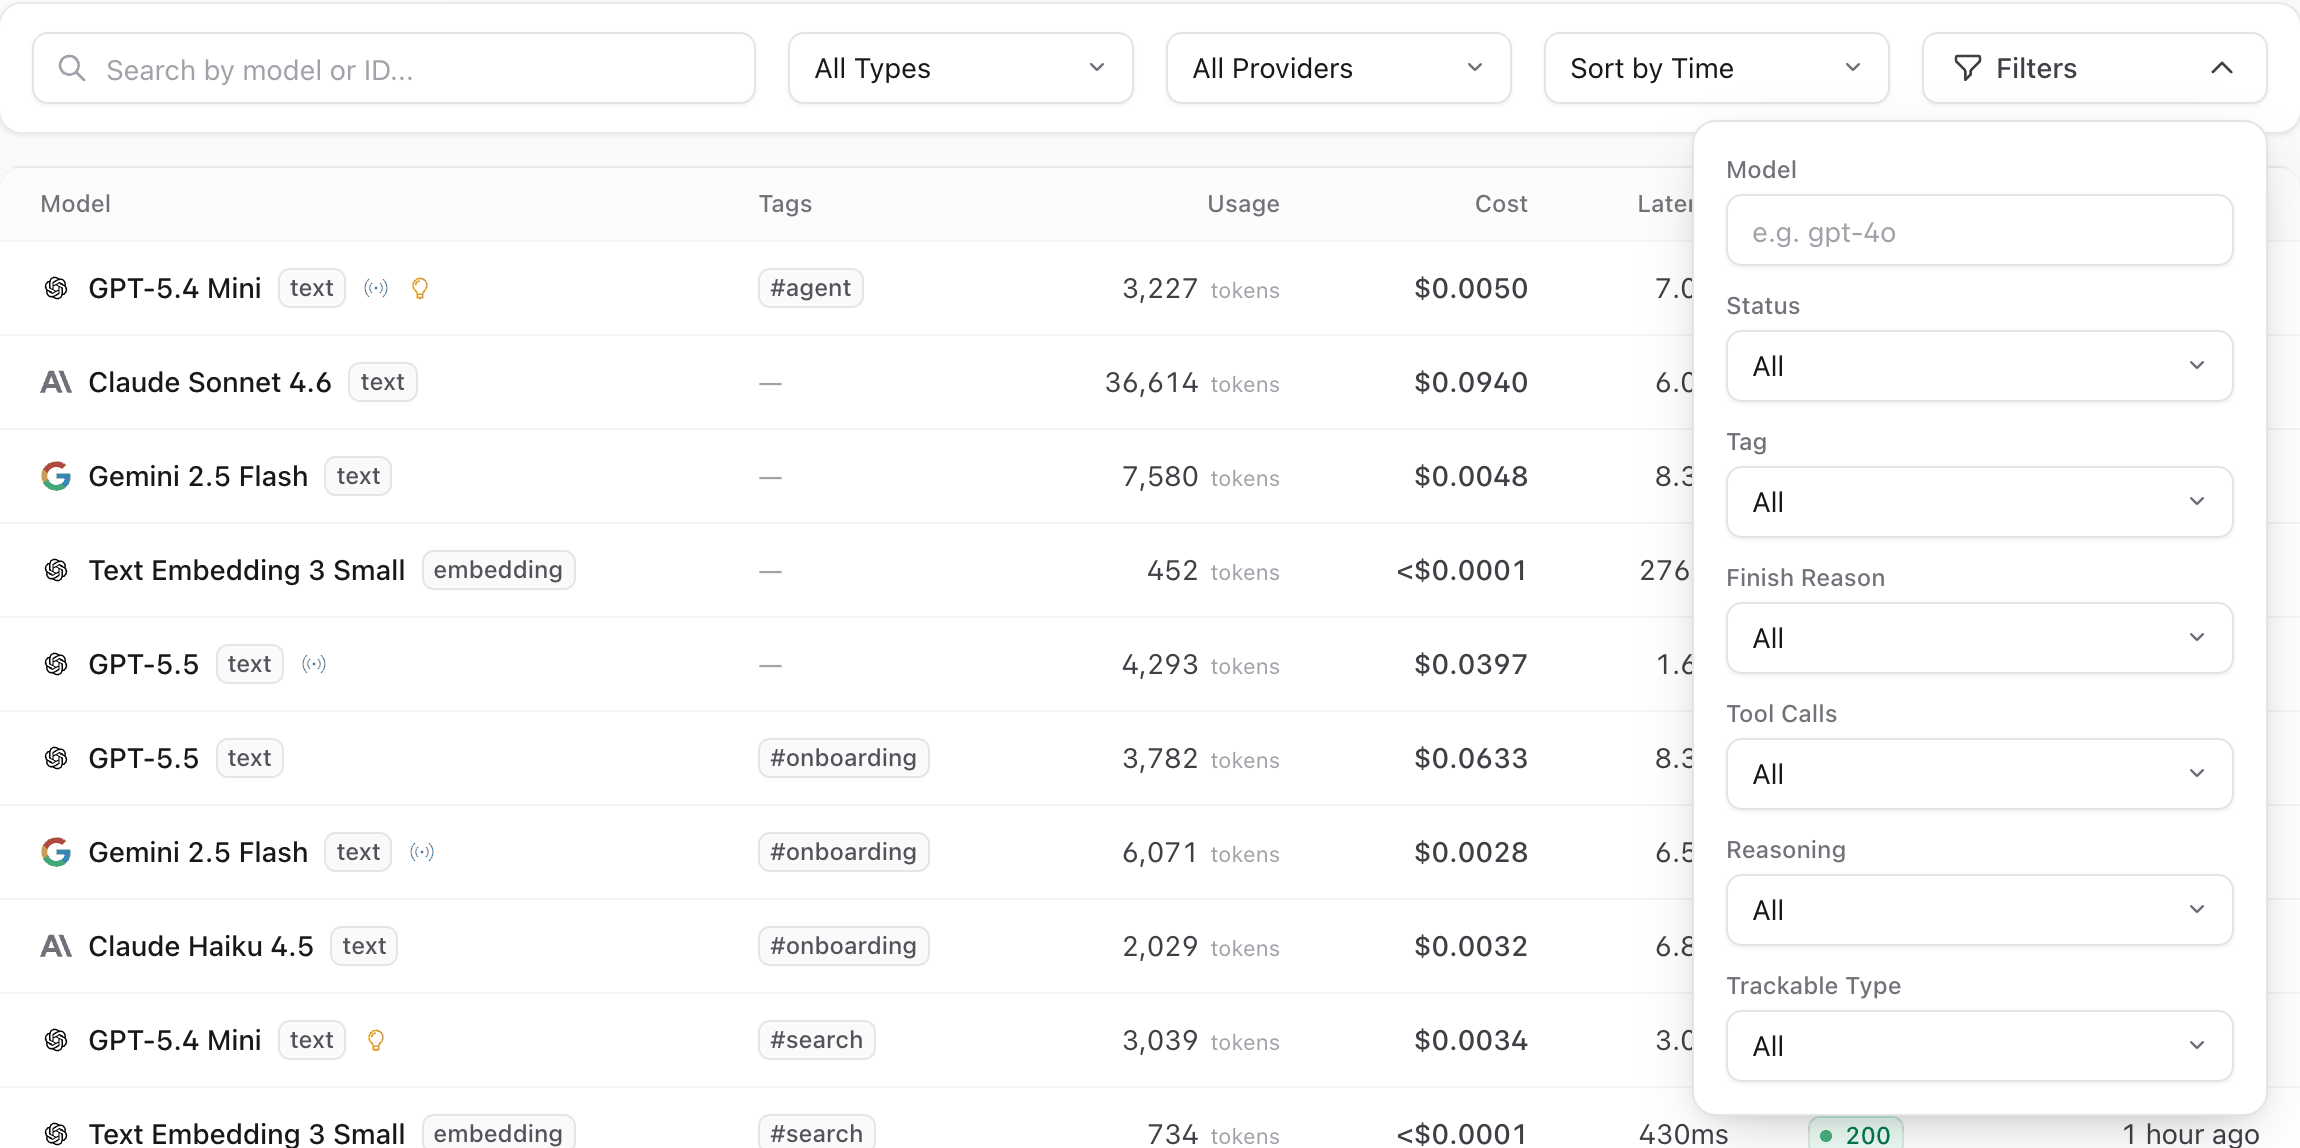
Every screen has a period picker (today, this week, this month, this year, all time) and a date range picker. The lists filter by model type, provider, tag, finish reason, trackable type and more, and keep the filters in the URL, so you can share a filtered view.
As everywhere in Spectra, request counts include failed requests, while cost and latency cover successful requests only (see Costs).
Overview
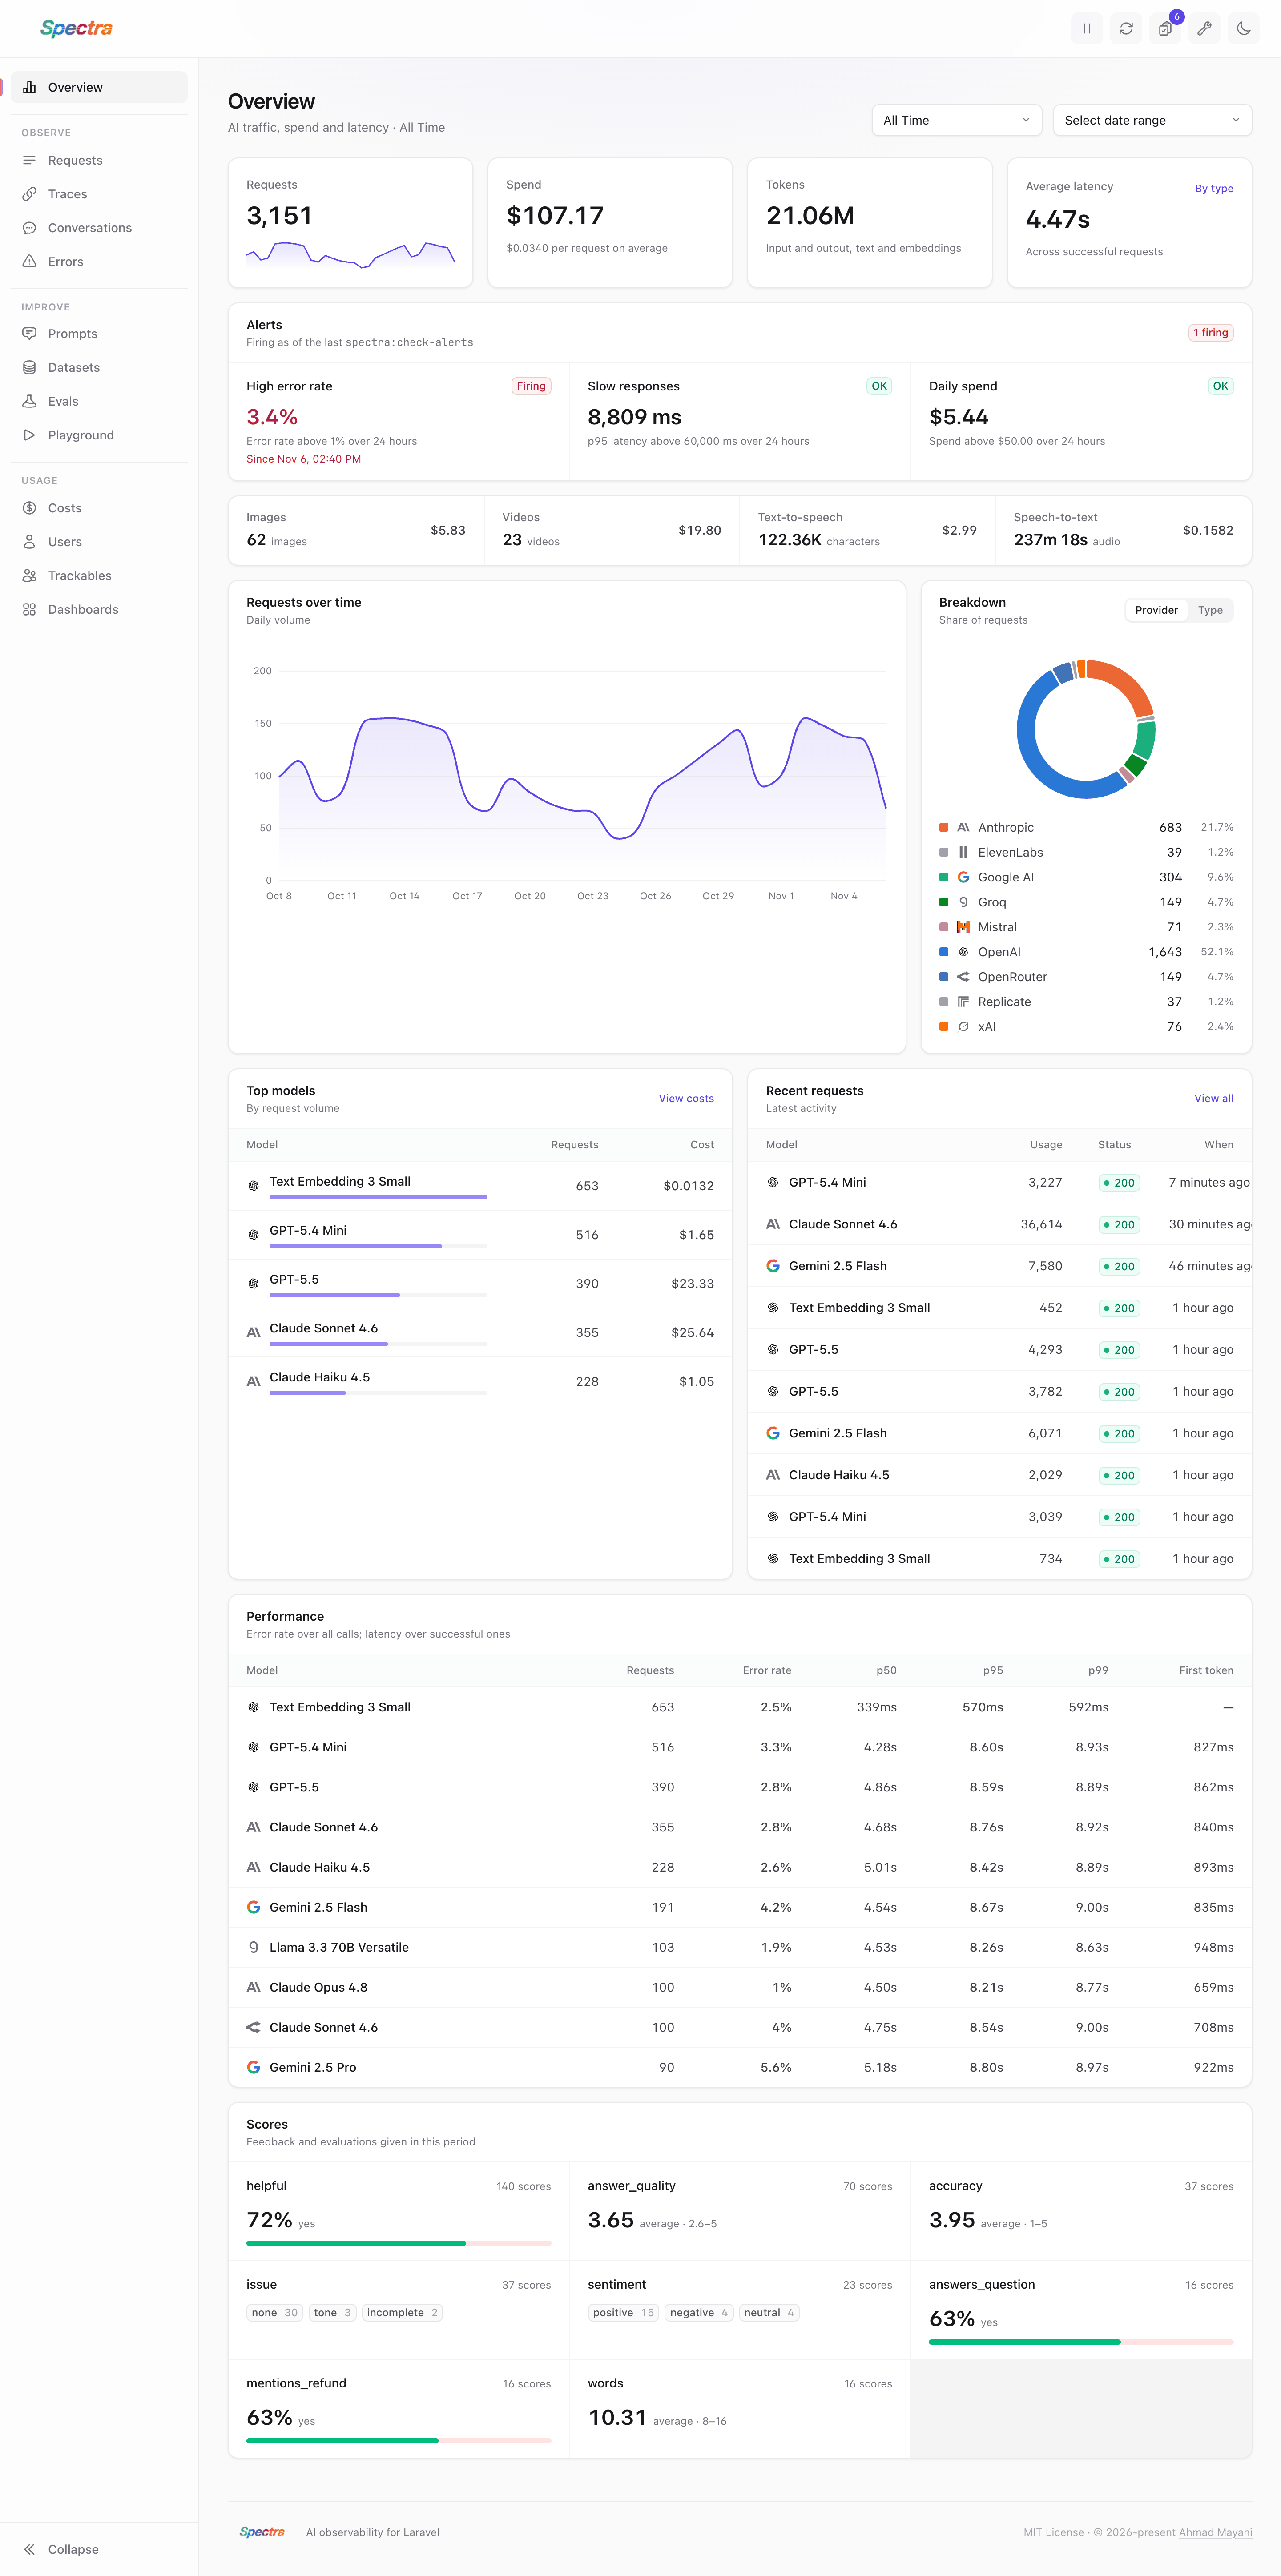
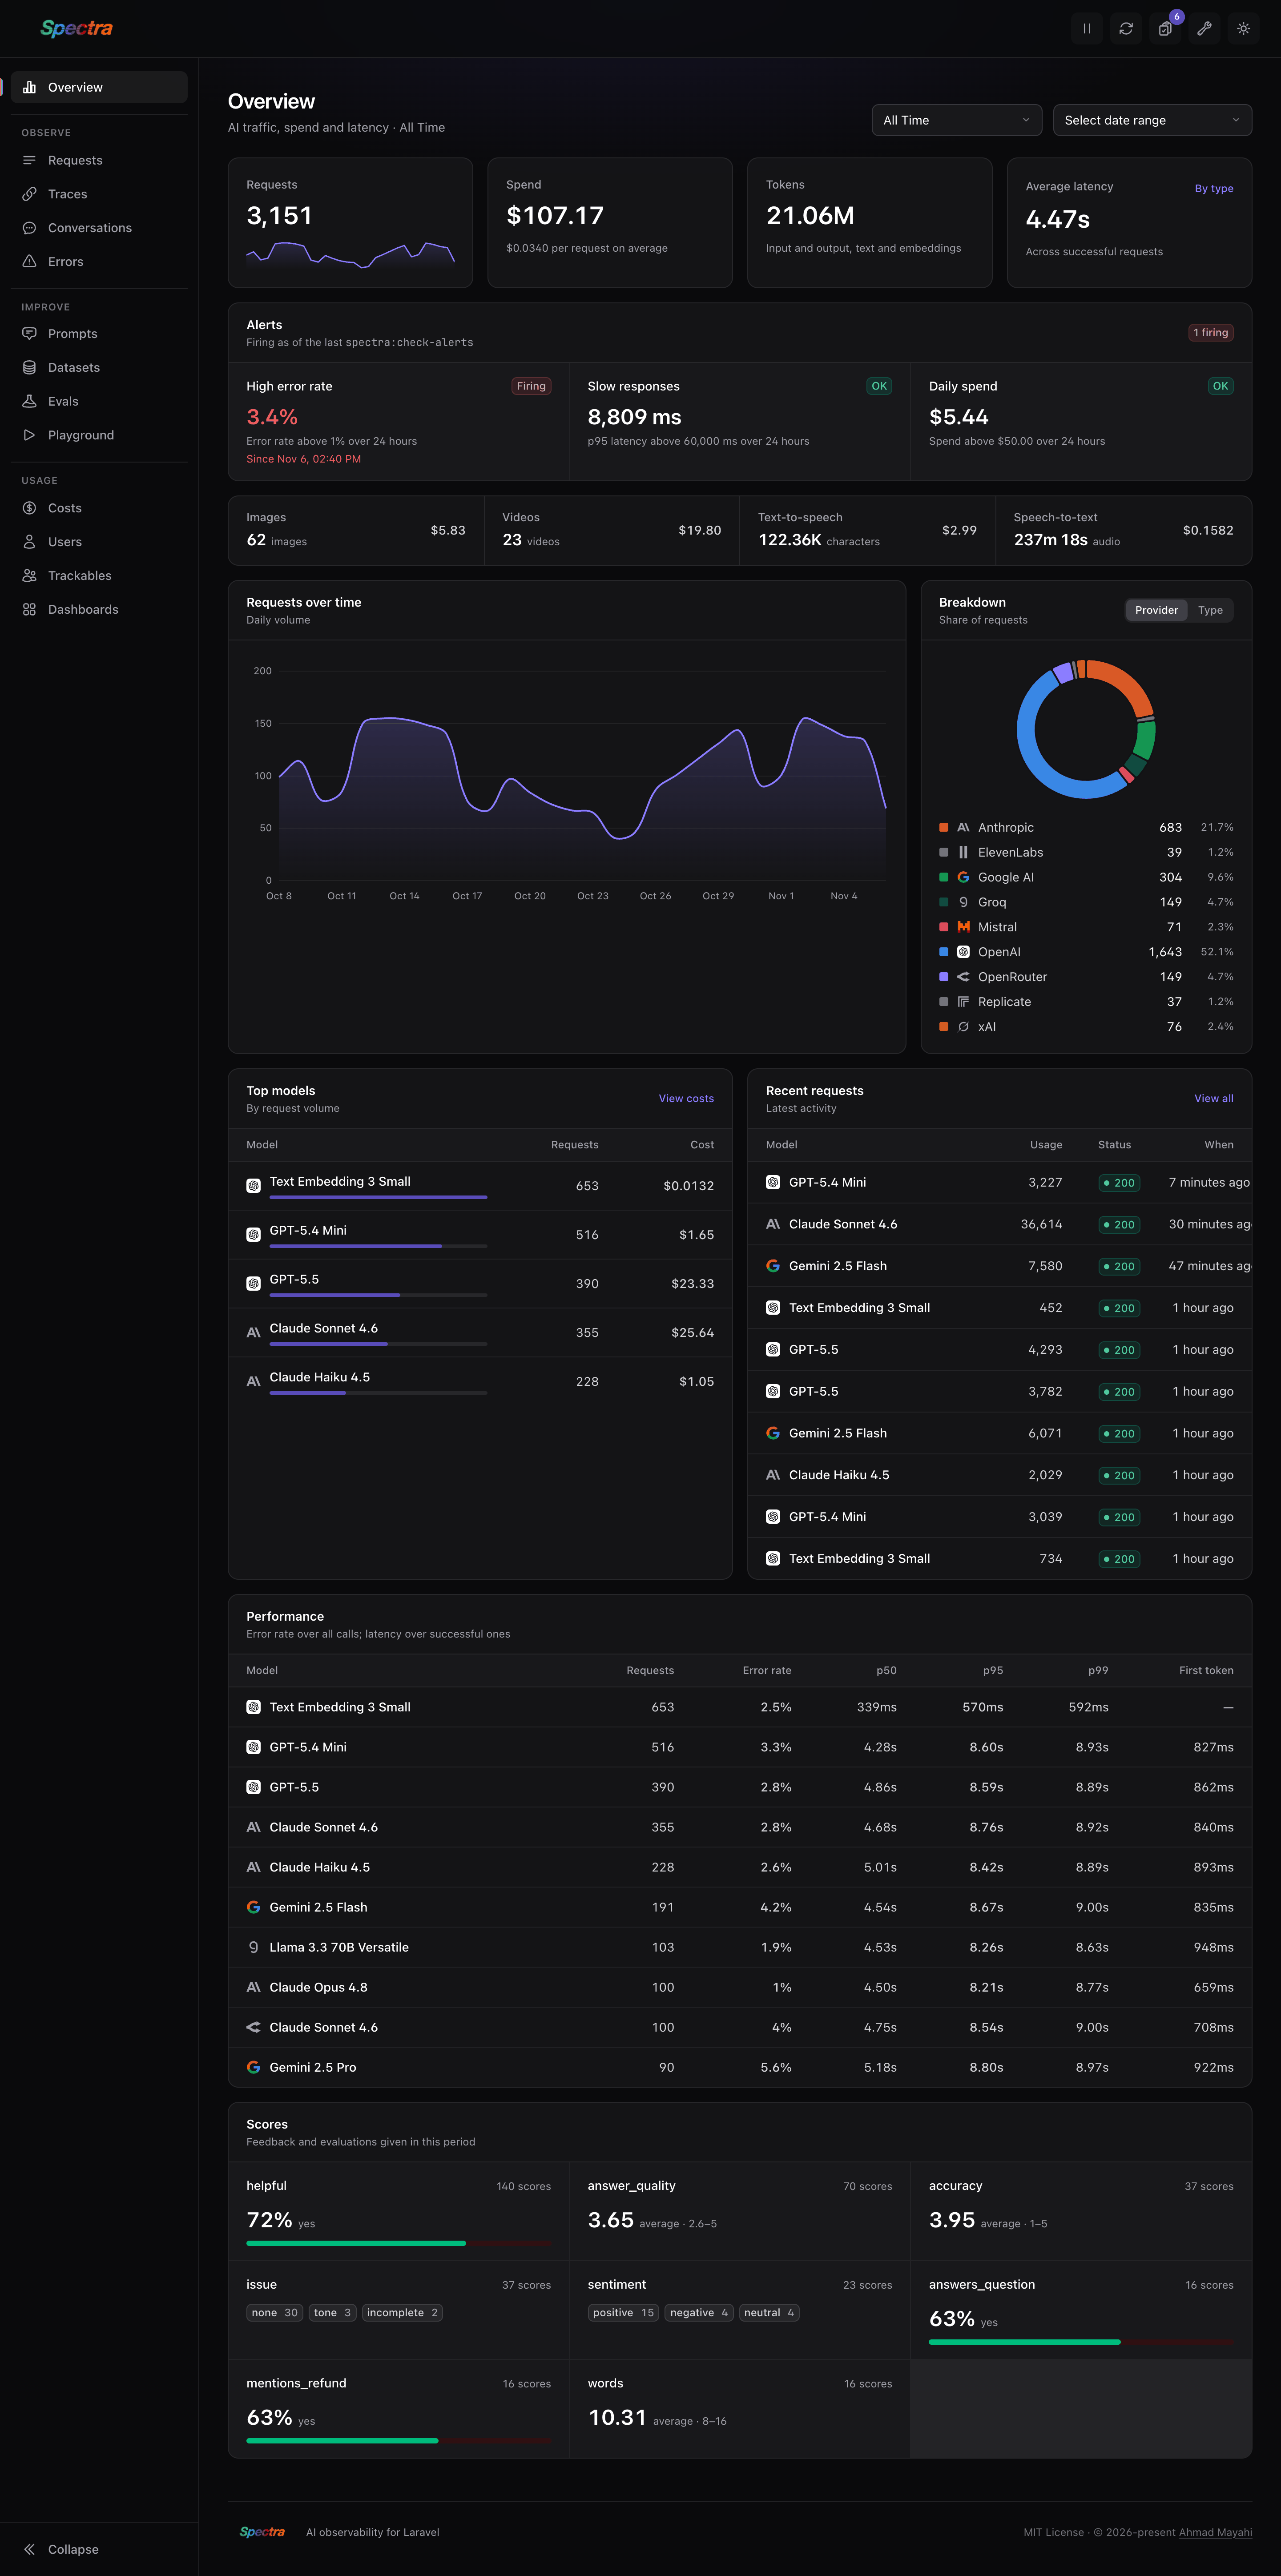
The overview answers "how much AI are we using, and what does it cost?" at a glance:
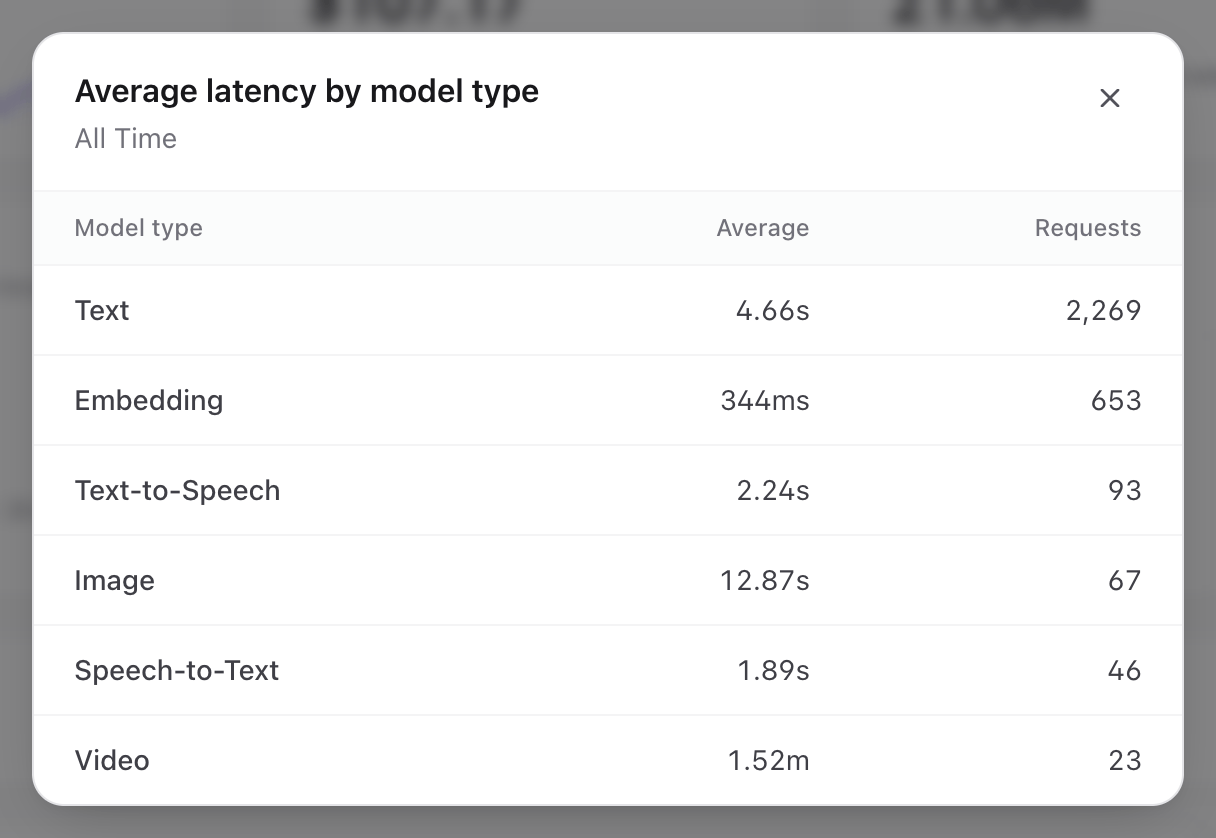
- Requests, spend, tokens and average latency for the period. Click By type to see the latency of each model type. When calls in the period were recorded at $0 because their model has no price, the spend card says how many and names the models (see Zero-Cost Requests).
- Media usage: images, videos, text-to-speech characters and speech-to-text audio, each with its cost. A kind only shows when the period has that traffic.
- Requests over time, one point per day.
- Breakdown of requests by provider or by model type.
- Top models by request volume, and the recent requests.
- Alerts: each alert rule with its value now and whether it is firing. It shows once you configure rules.
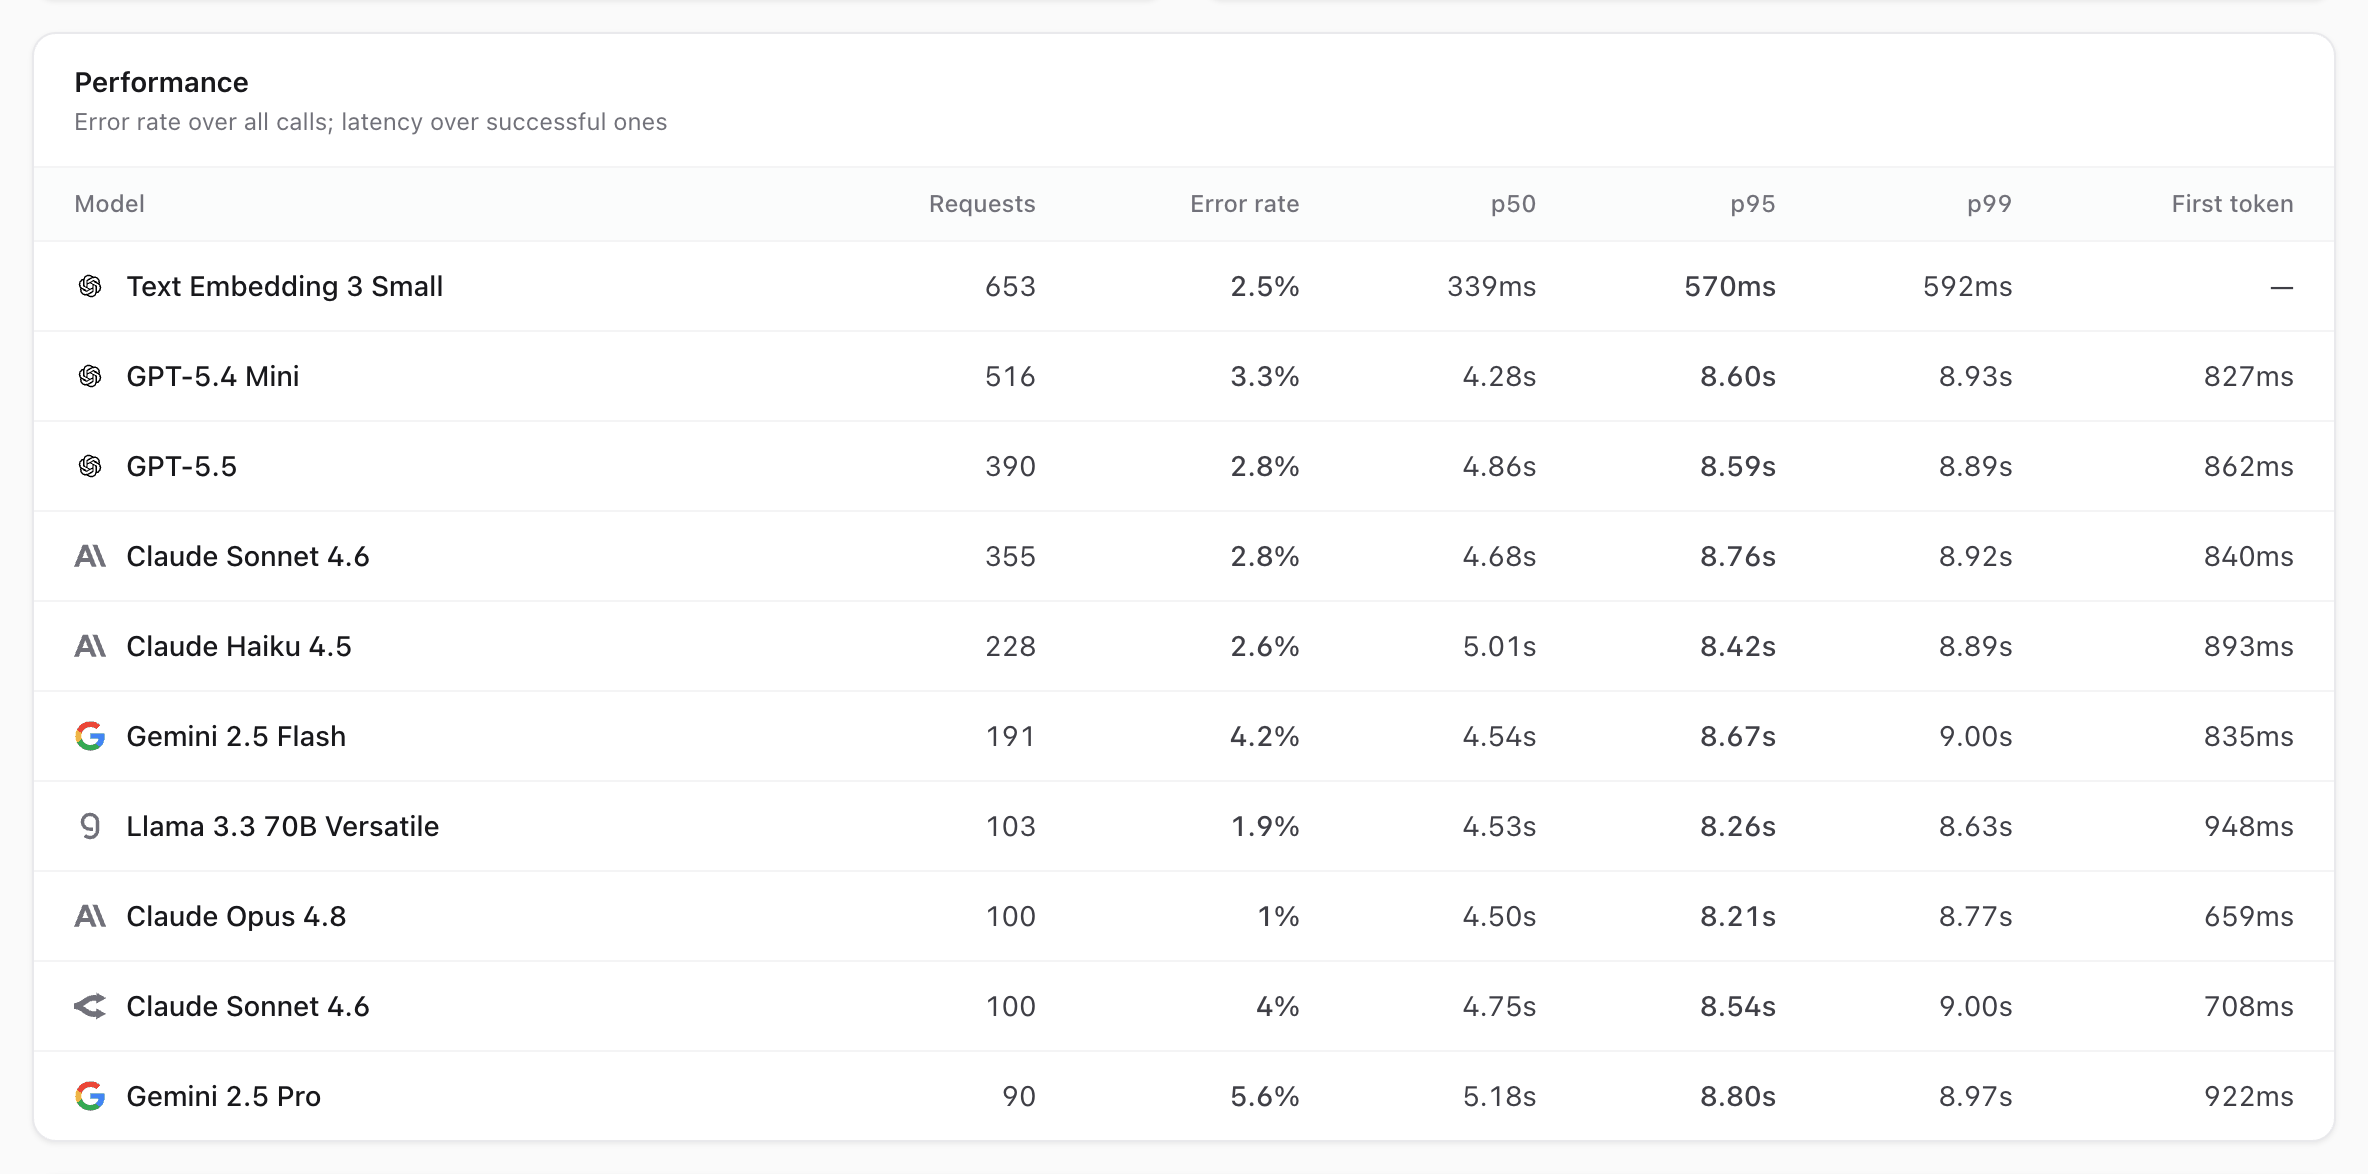
- Performance: each model's error rate and how long its calls take at the p50, p95 and p99 marks, that is, the time within which 50, 95 and 99 of every 100 calls finished. The p50 is the typical call; the p95 and p99 show how bad the slow ones get. For streamed calls, the median time to first token: how long a user waited before the first word appeared.
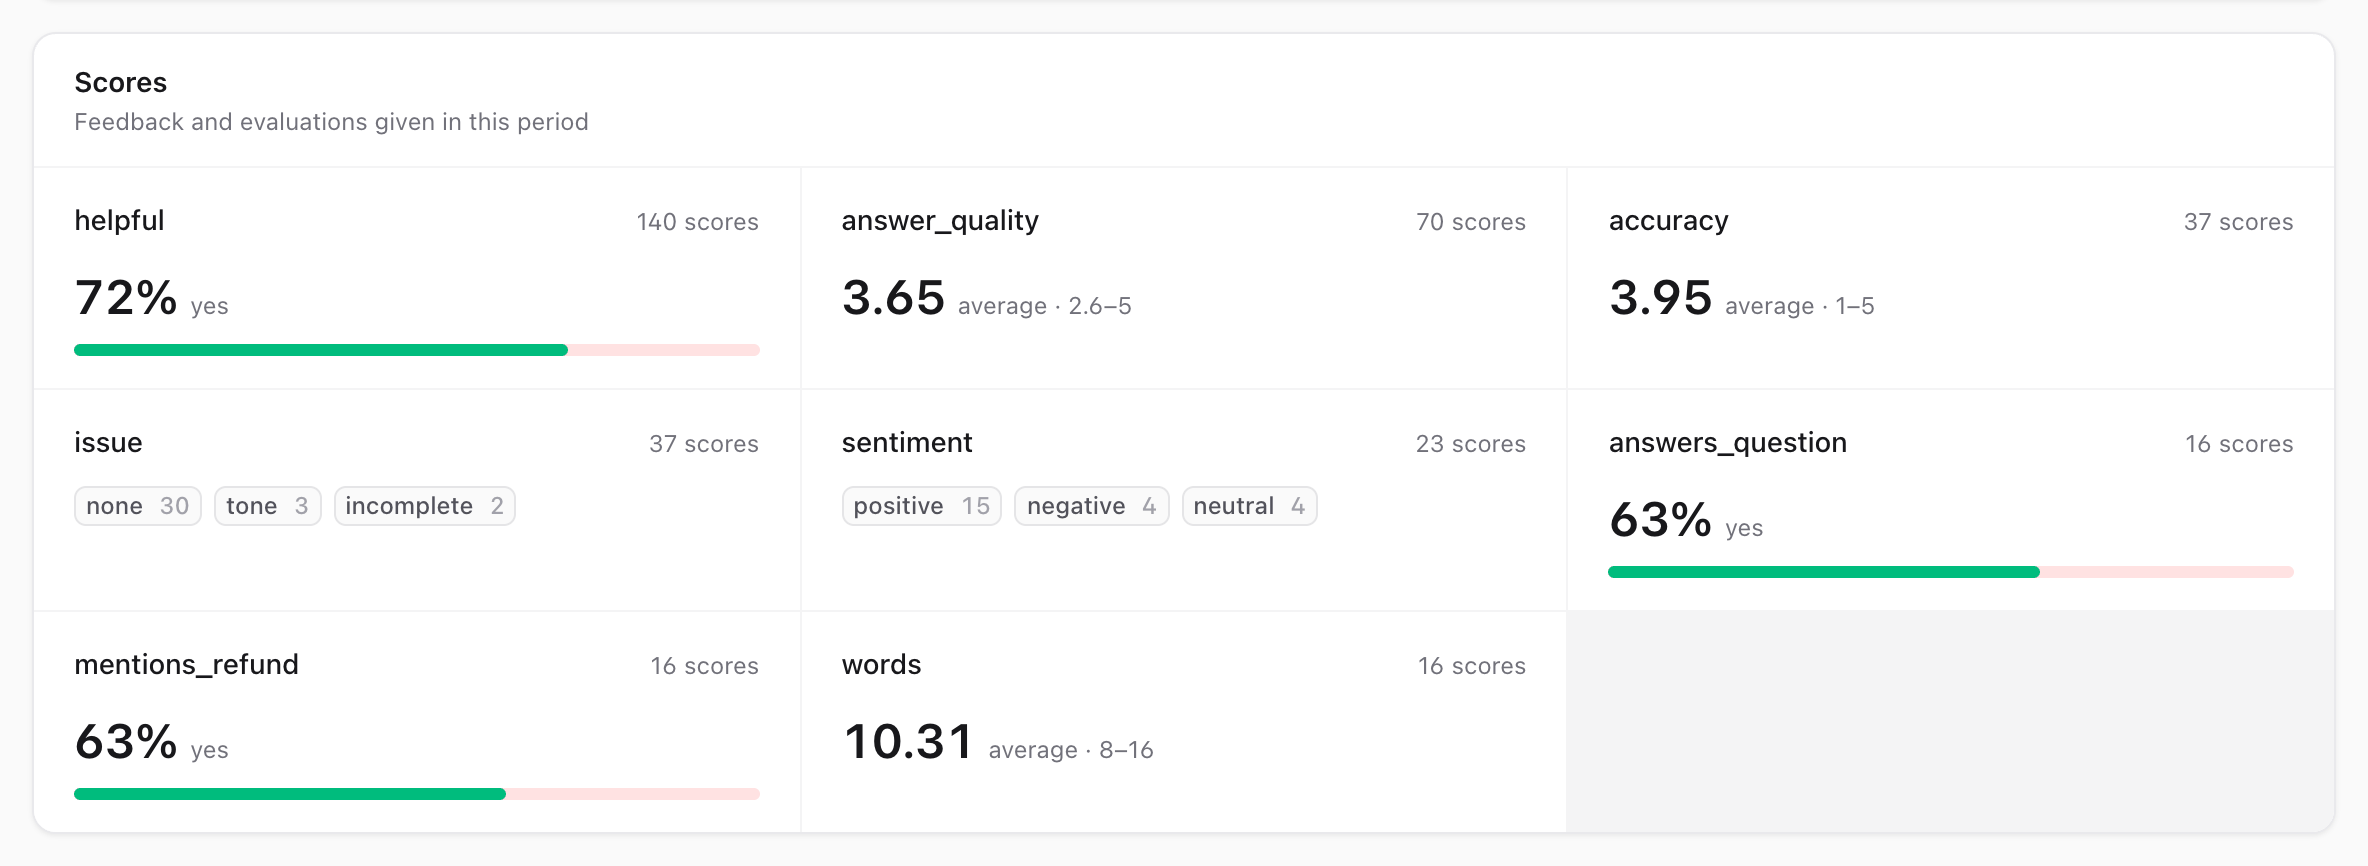
- Scores: each score name given in the period, with the share of yes, the average, or the most common labels. It shows once your app records scores.
The media usage row shows what the period's images, videos and audio cost, next to the token traffic:

The alerts card shows each rule's value as of the last check. A firing rule turns red and says since when it fires:

The performance card puts each model's error rate next to its latency percentiles:
The scores card sums up every score name: the share of yes for a boolean score, the average and range for a numeric one, and the labels for a categorical one:
The request, trace and conversation pages list their own scores too, with any comment, who gave each one, and a link to the call a score was given to.
The dashboard.layout option narrows the dashboard to one model type, for example text or image. See Layout Modes.
Requests
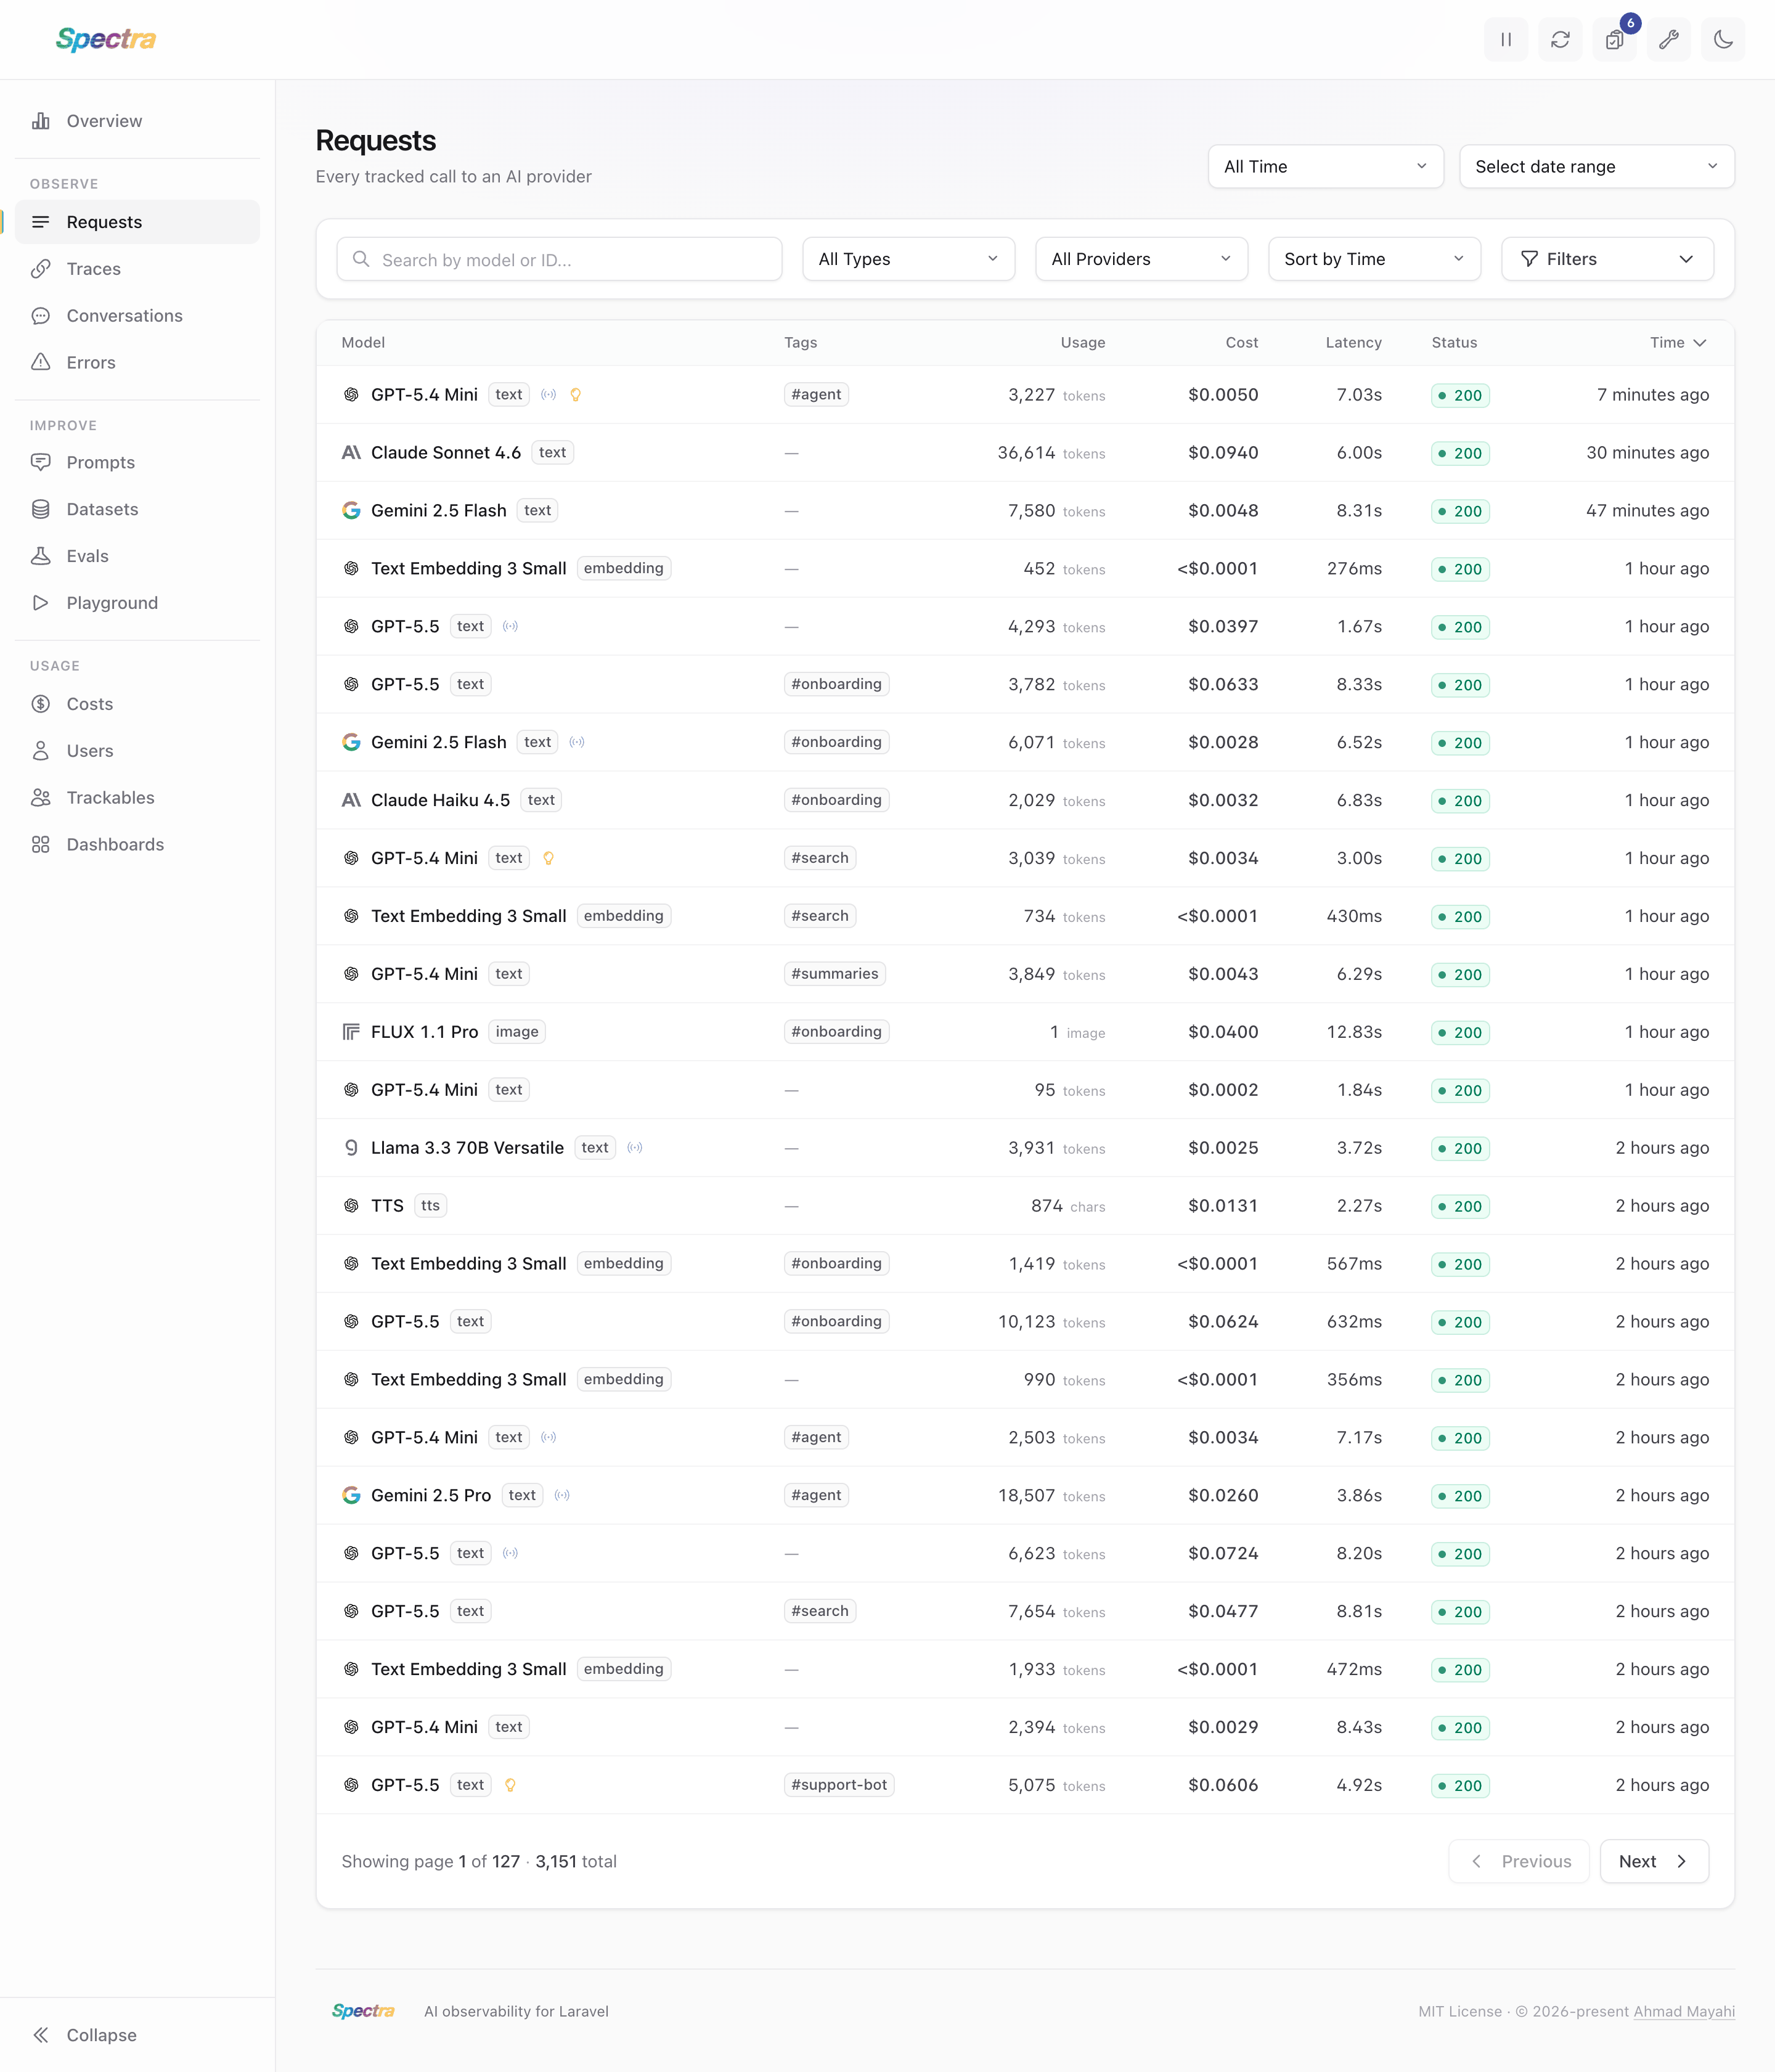
The requests list shows every tracked AI call: its model and type, its tags, its usage (tokens, images, characters or seconds), its cost, latency and status. Search by model, or paste a request ID, response ID or trace ID. Filter by model type, provider, tag, finish reason, trackable type (only the calls attributed to a User, a Team, ...) and more, and sort by time, cost, usage or latency.
Request Details
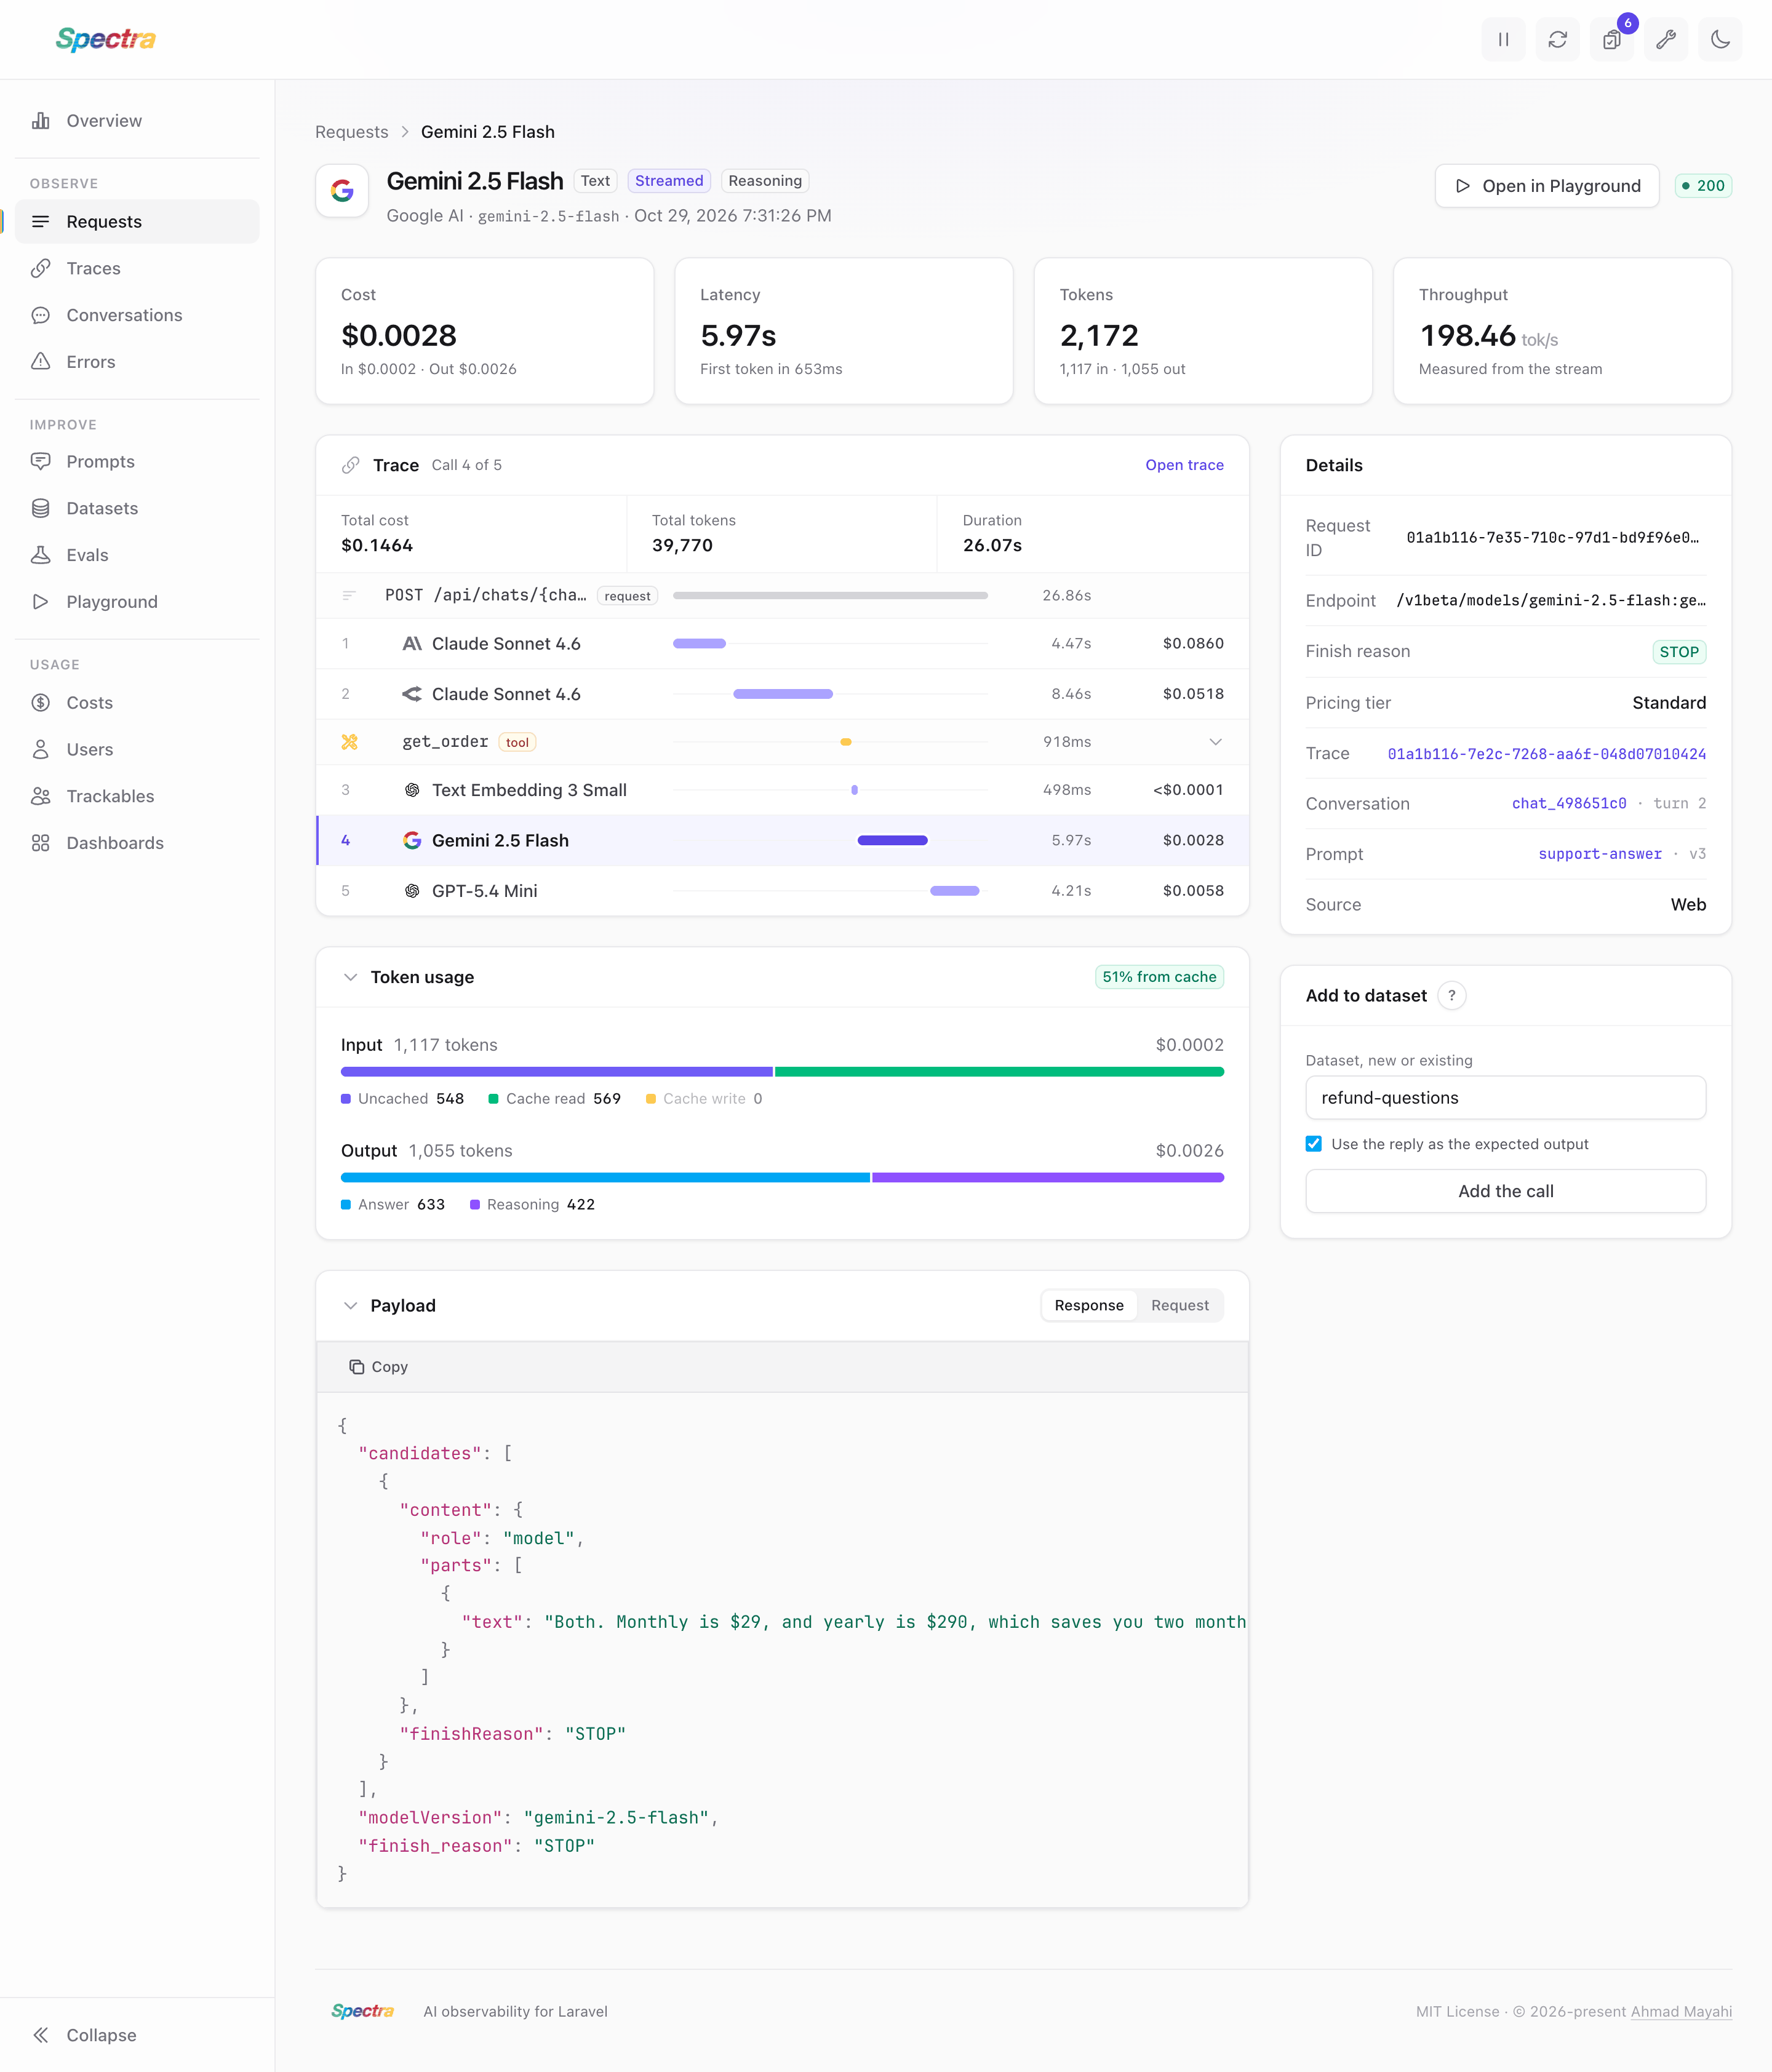
Open a request to see everything Spectra recorded about it:
- Cost, split into input and output, latency with the time to first token for streamed responses, tokens in and out, and the throughput of the stream.
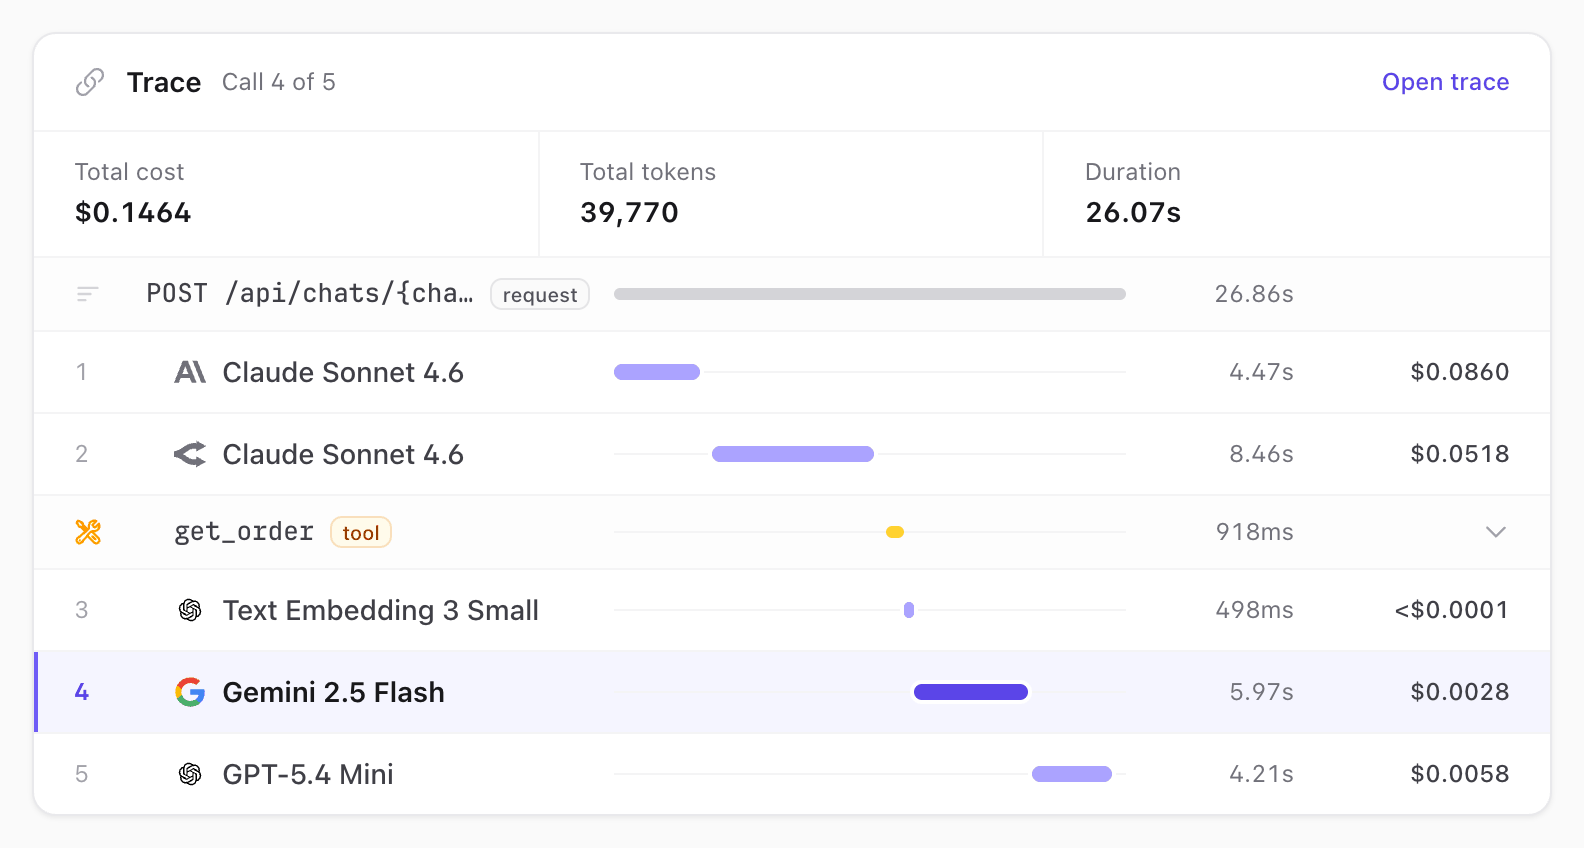
- Trace: when the call is part of a trace with more than one call, the other calls of the trace and a link to open it.
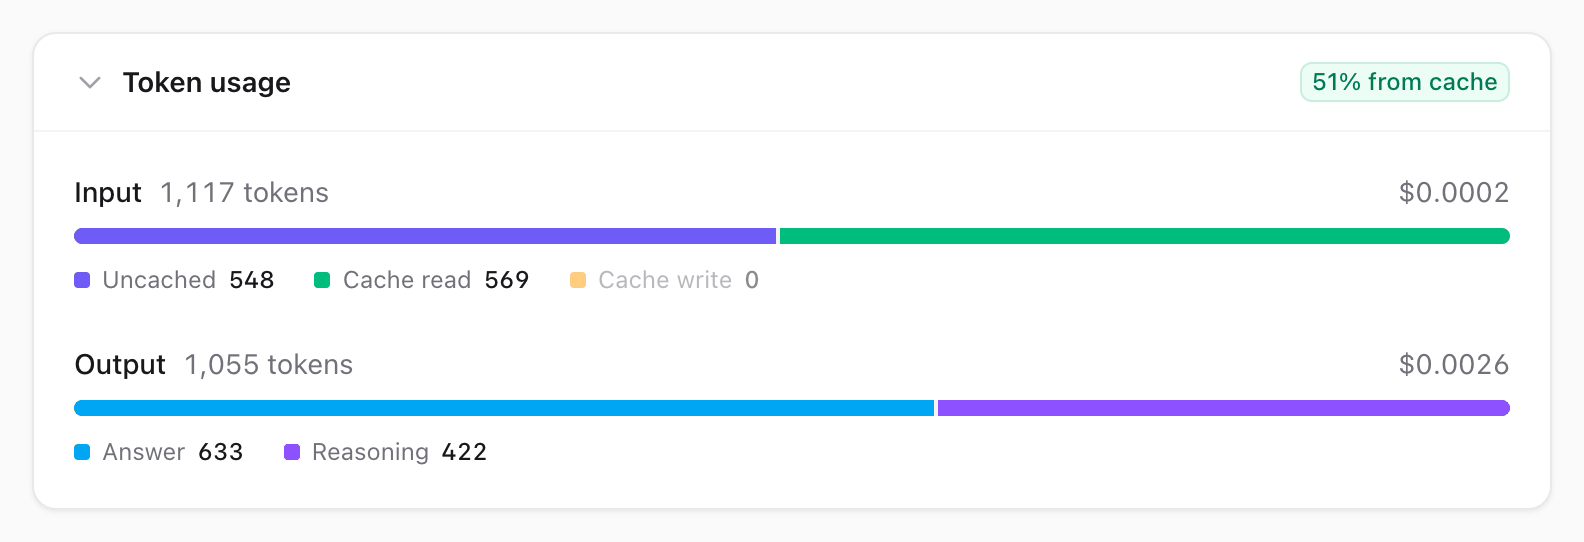
- Token usage: input split into uncached tokens, cache reads and cache writes, and output split into the answer and reasoning, each with its cost.
- Details: the request and response IDs, endpoint, finish reason, pricing tier, trace, conversation and source.
- Payload: the stored response and request. Generated images, audio and video show in place when media persistence is on.
The payload shows only what your storage settings keep.
The trace card shows where the call sits among the other calls of its trace, with the tools the model asked for between them:
The token usage card splits the input into uncached tokens and cache reads and writes, and the output into the answer and reasoning:
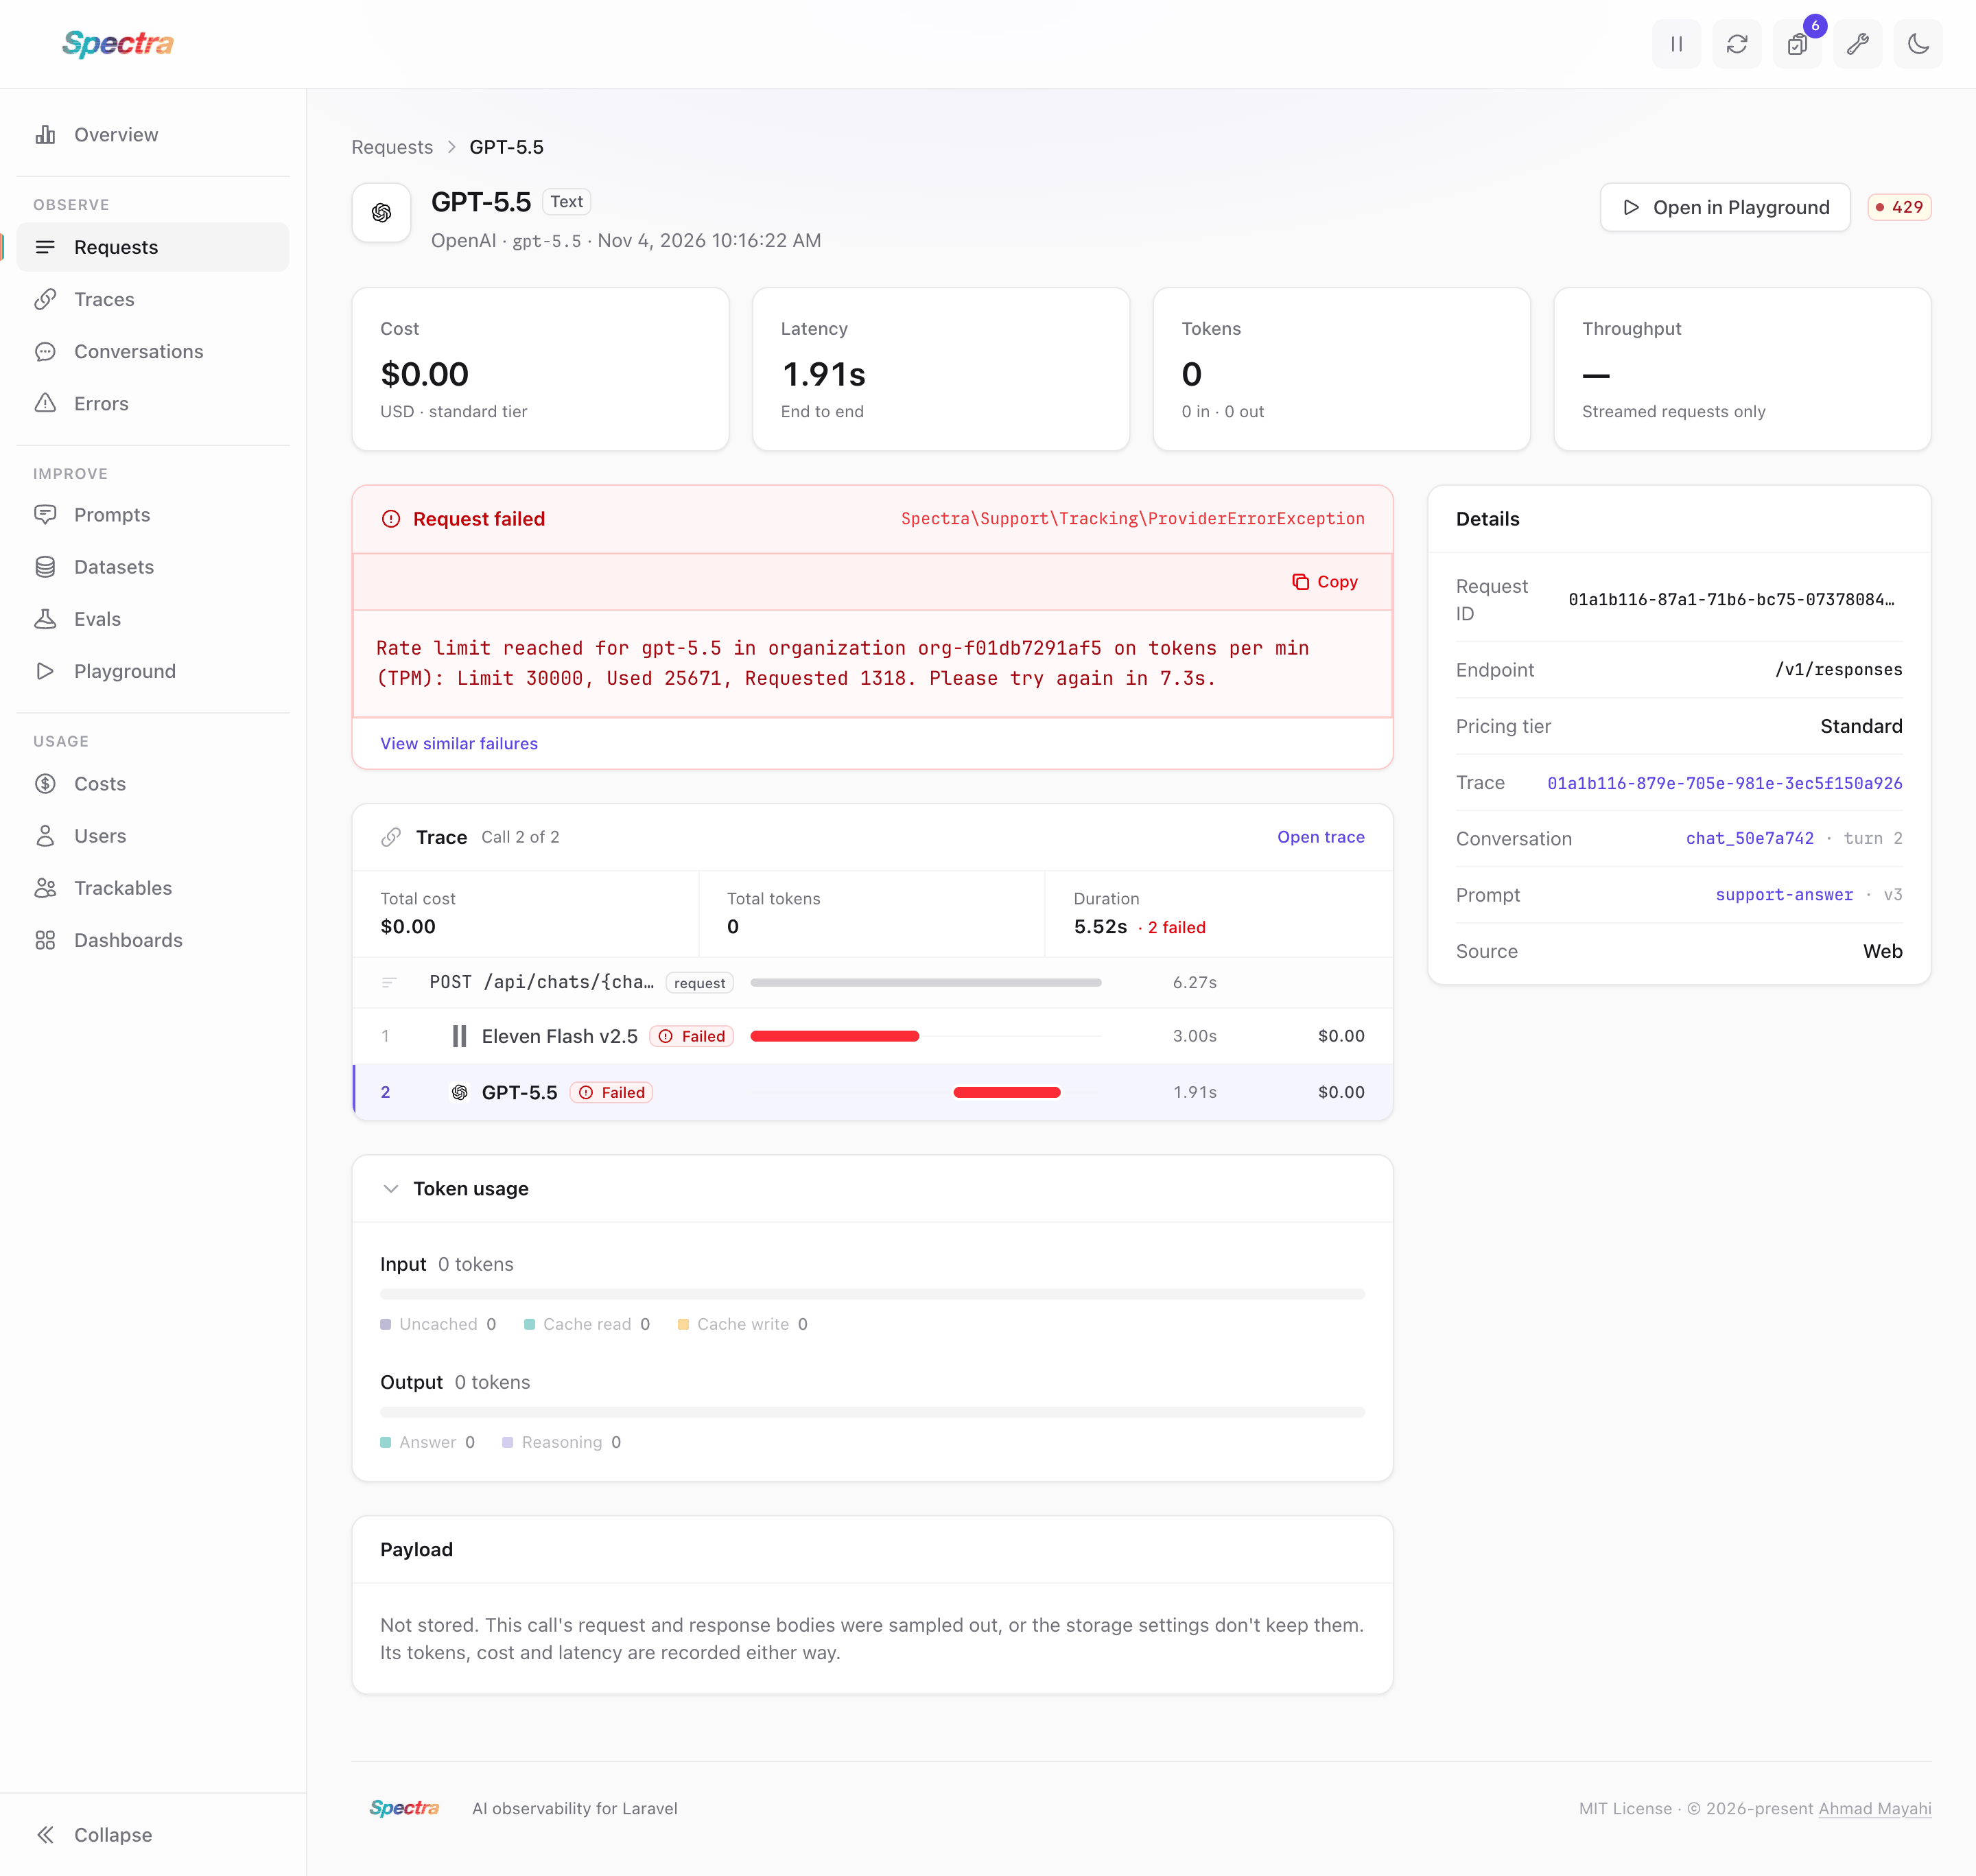
A failed call shows the provider's error and links to the calls that failed the same way:
Traces
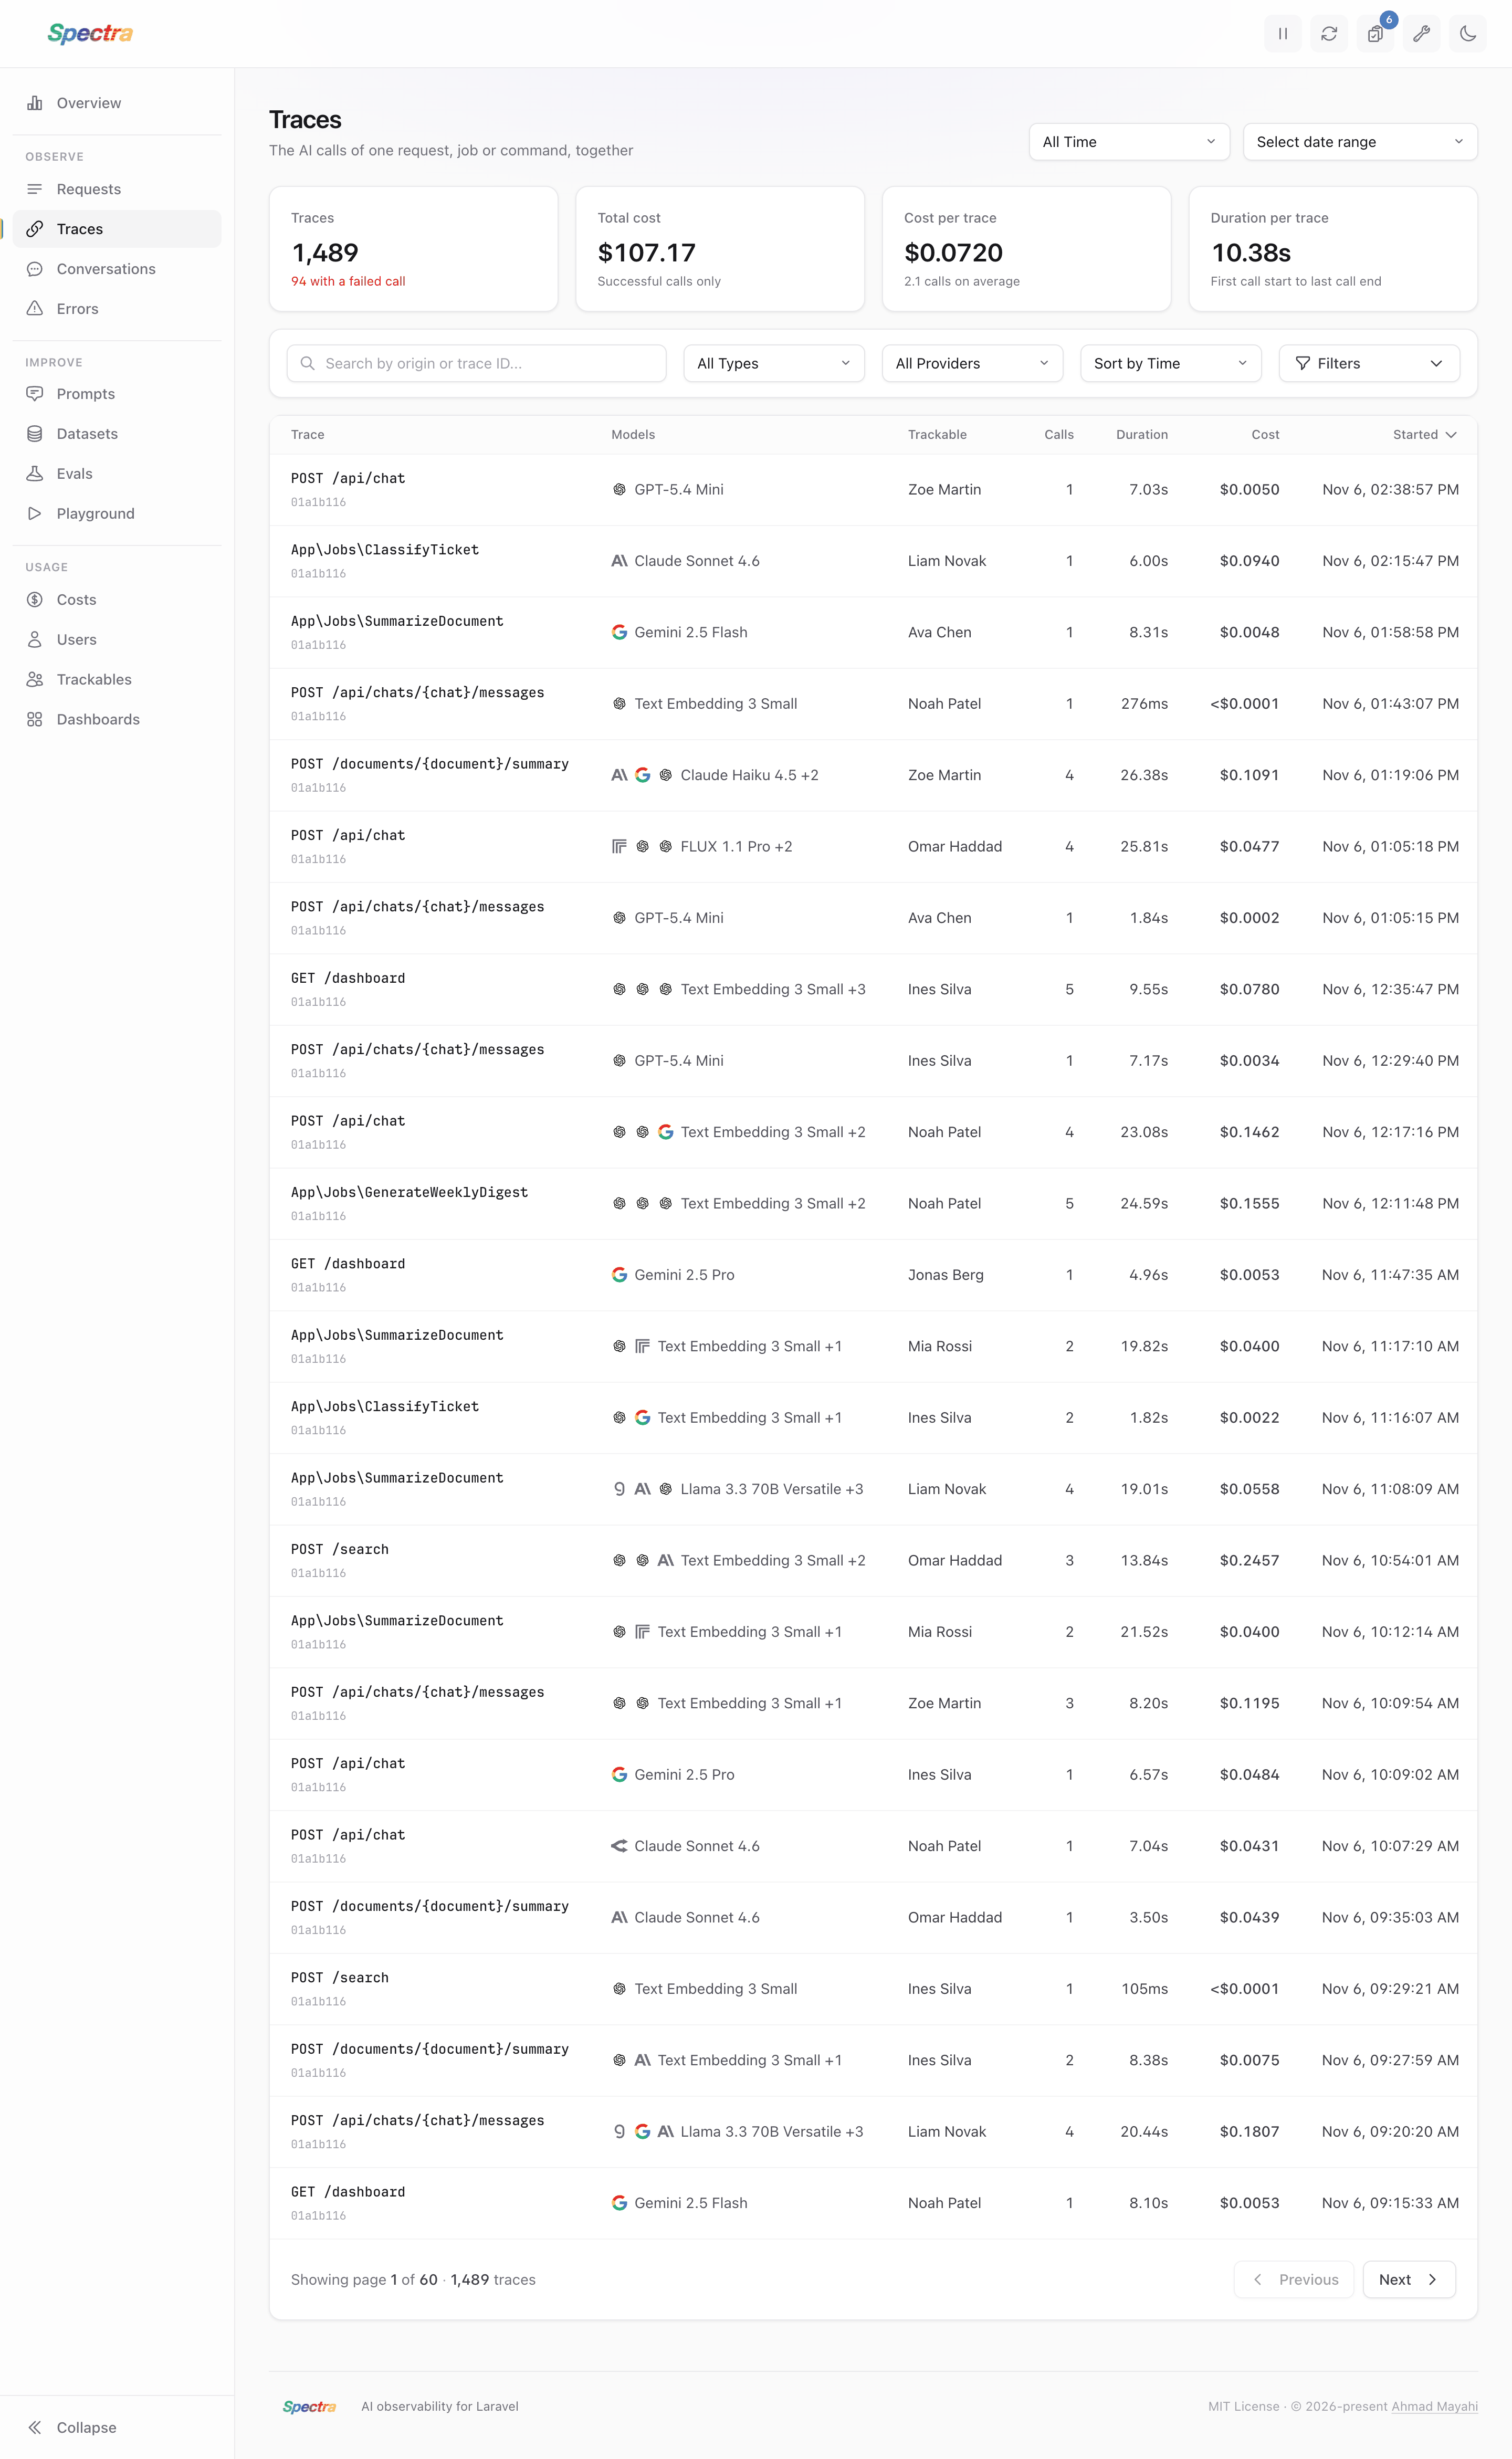
A trace groups the AI calls of one HTTP request, queued job or Artisan command. The traces list shows one row per trace: where it came from, the models it used, its trackable, its calls and failed calls, its duration and its cost. Above the list are totals for every trace you filter for. See Traces for how calls are grouped.
Trace Timeline
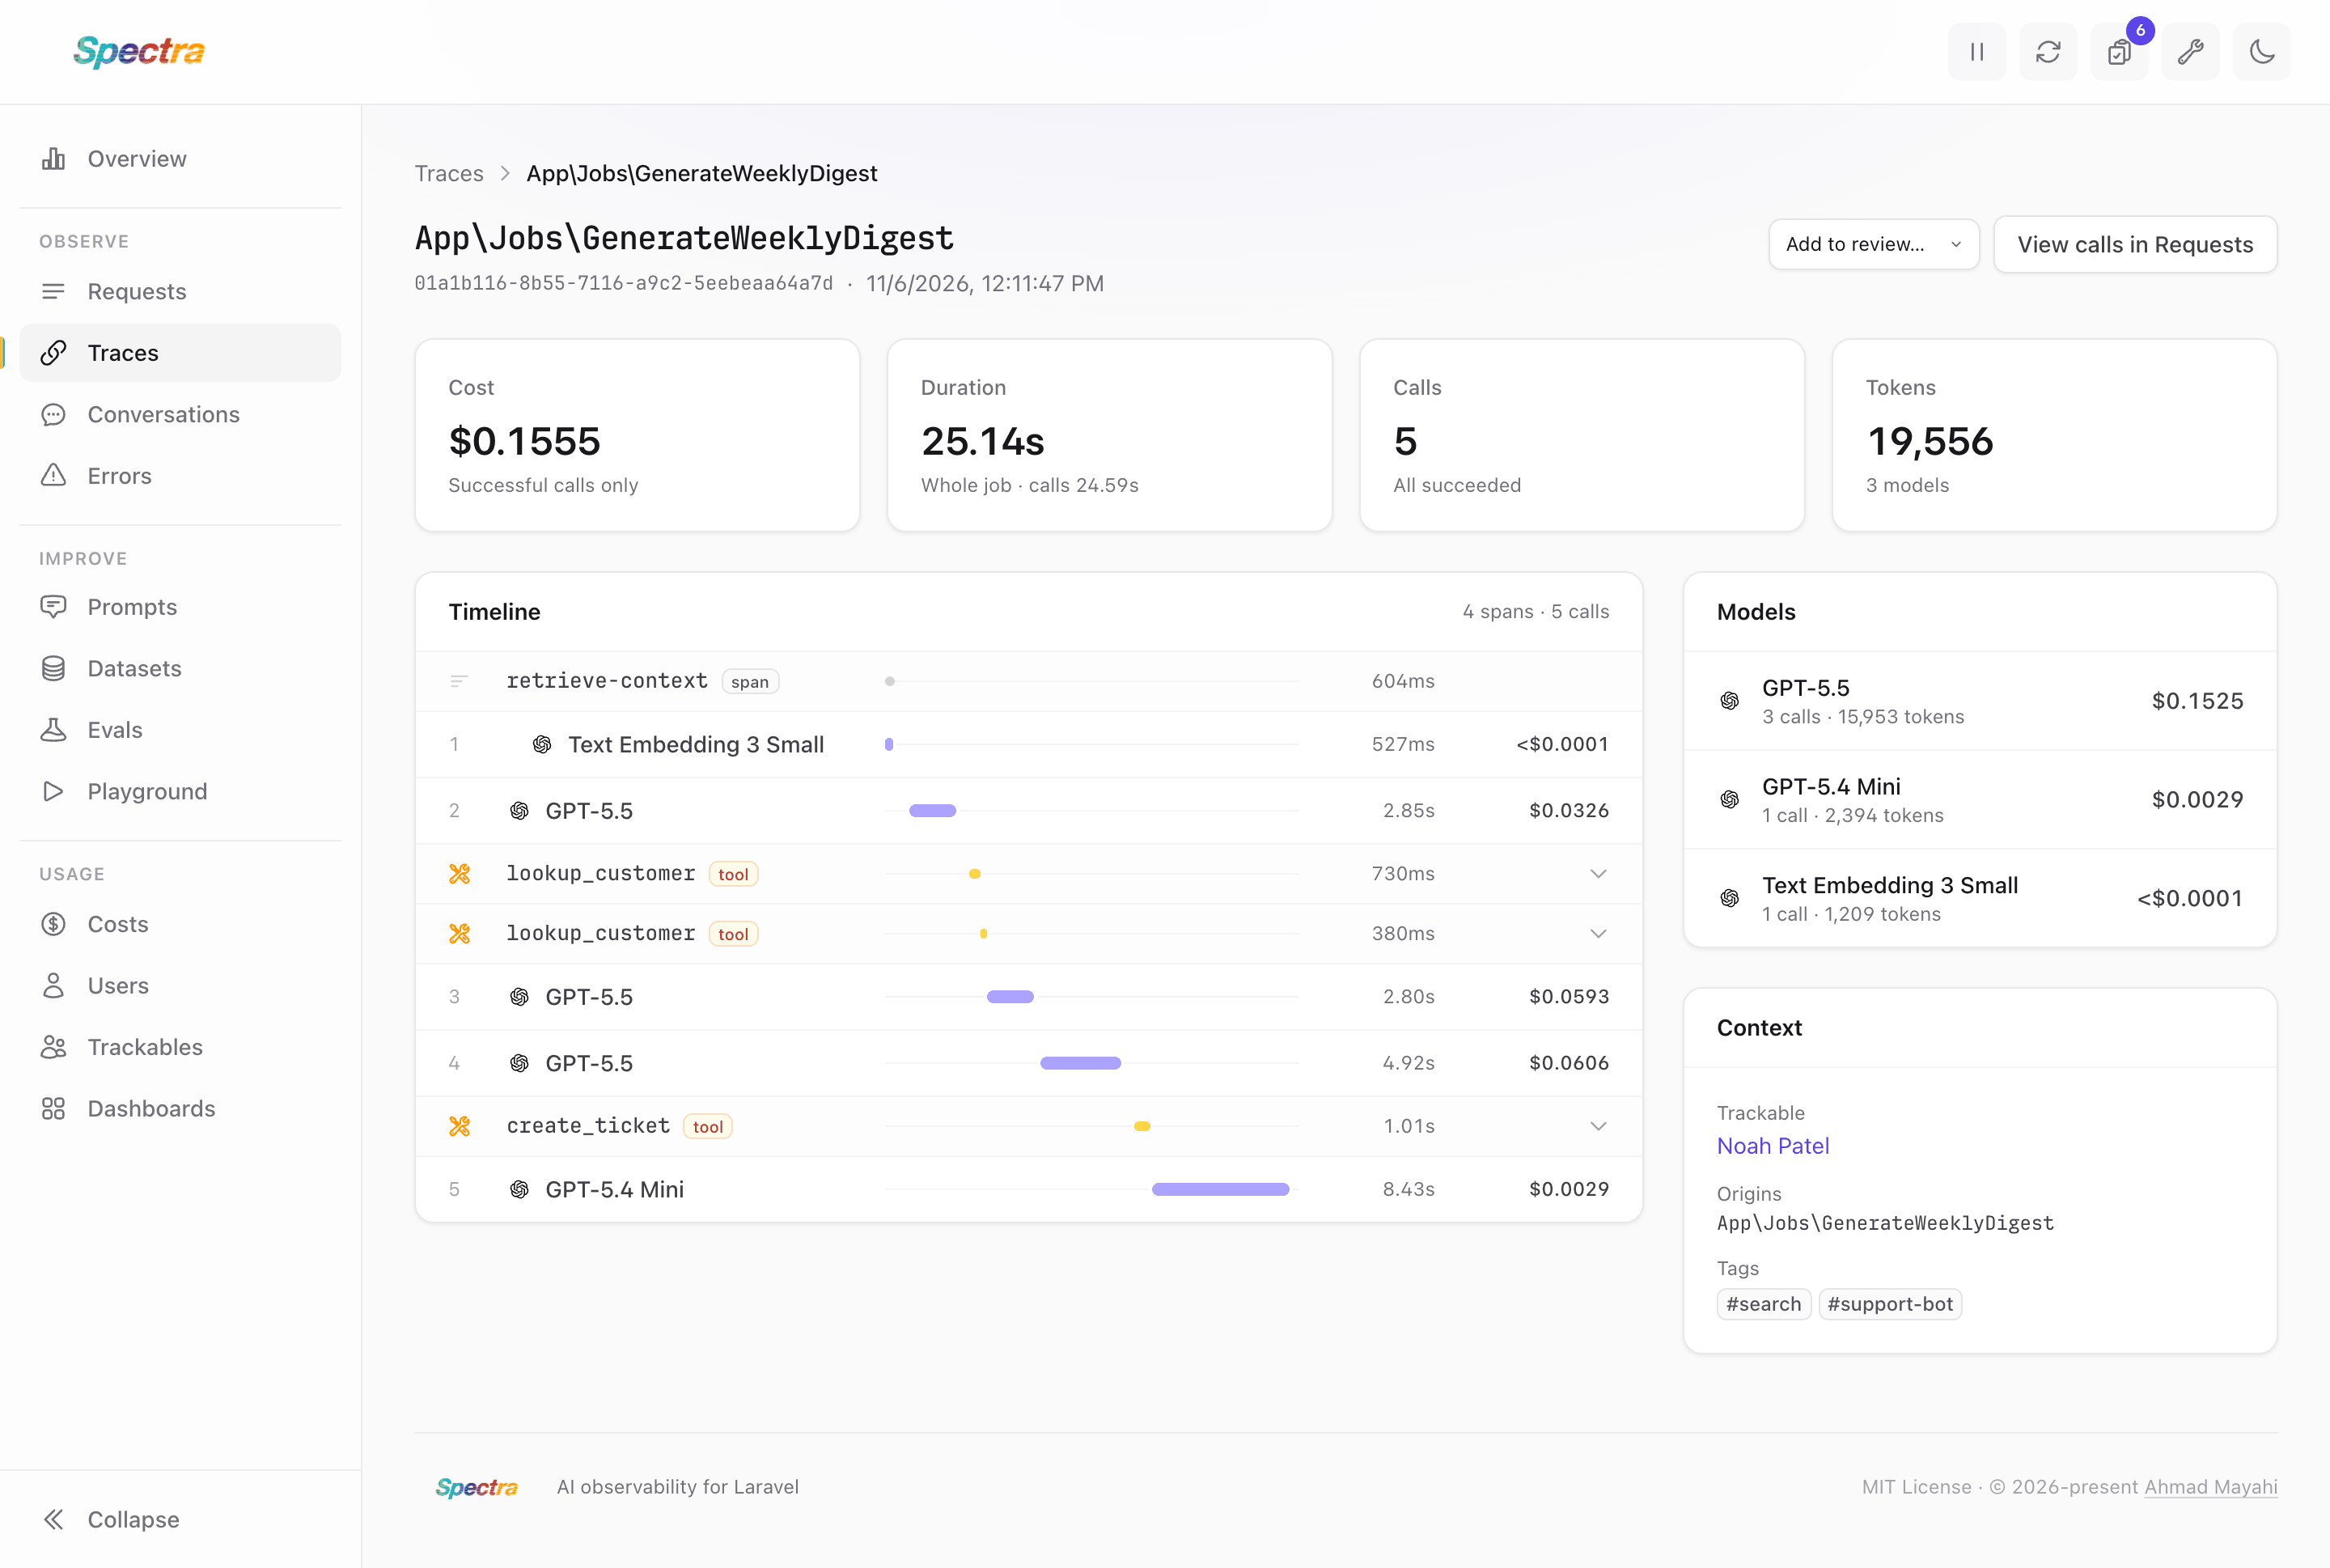
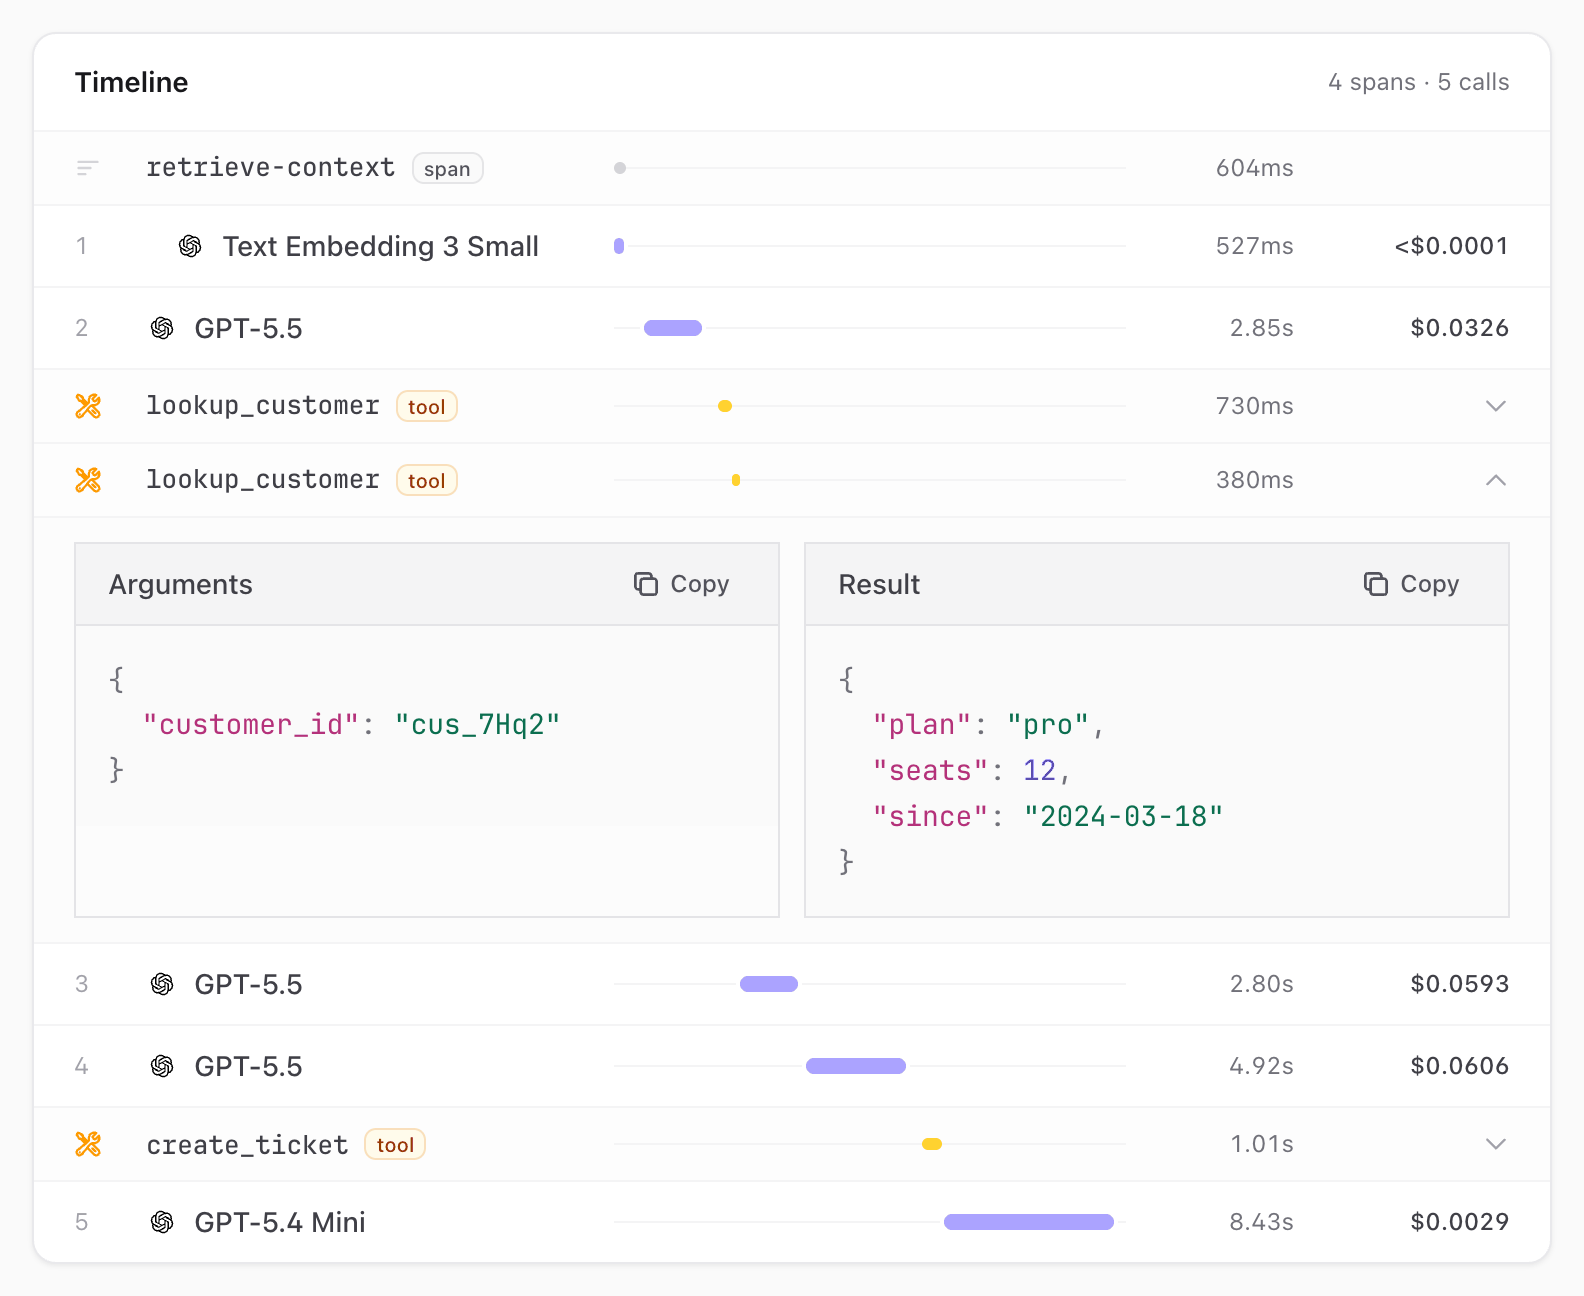
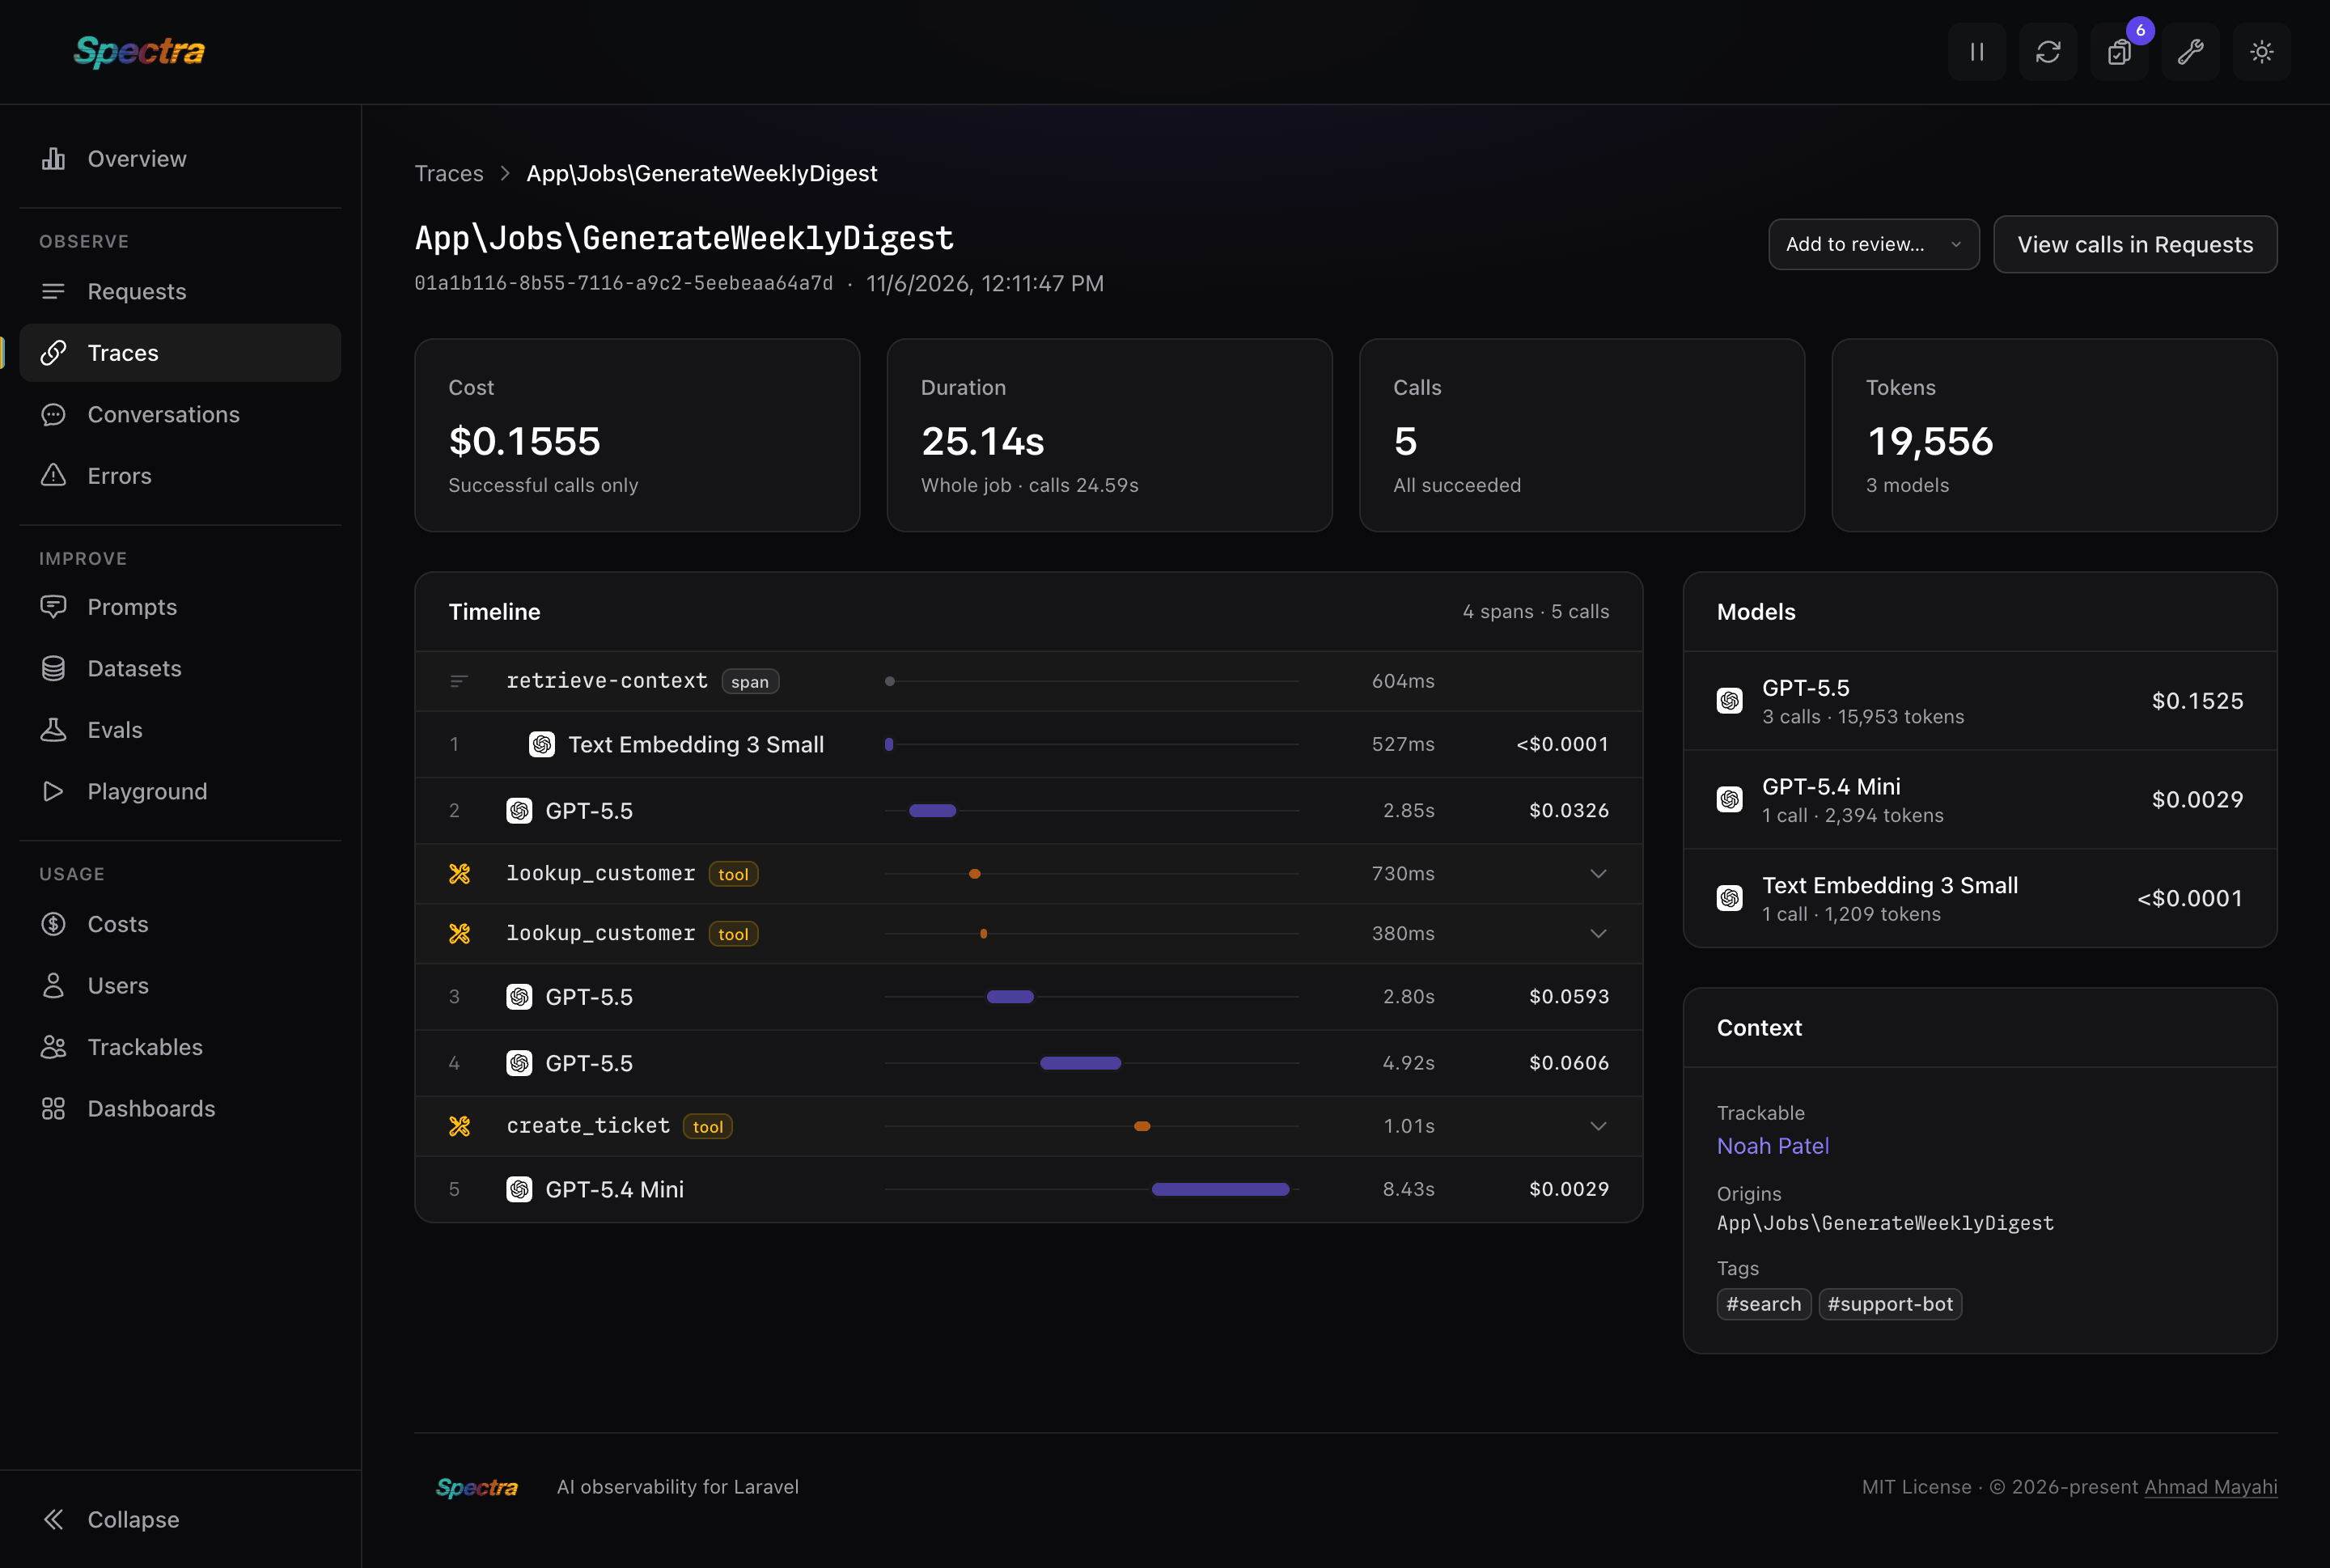
Open a trace to see its calls on one timeline, in the order they started, to the millisecond. The request, job or command sits at the top, and the calls are nested under the spans they ran in, such as the retrieve-context span above. A tool shows with a wrench between the calls around it; click it to see its arguments and result. The side panel shows the cost, calls and tokens per model, the trackable, the origins and the tags.
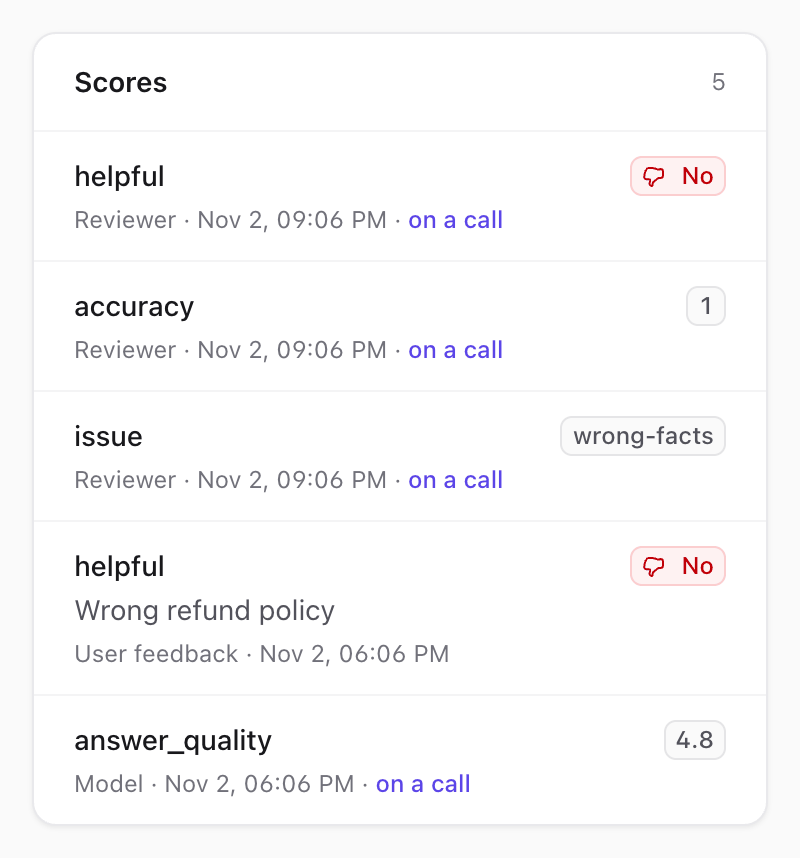
When the trace has scores, the side panel lists them, with a link to the call each one was given to:
Conversations
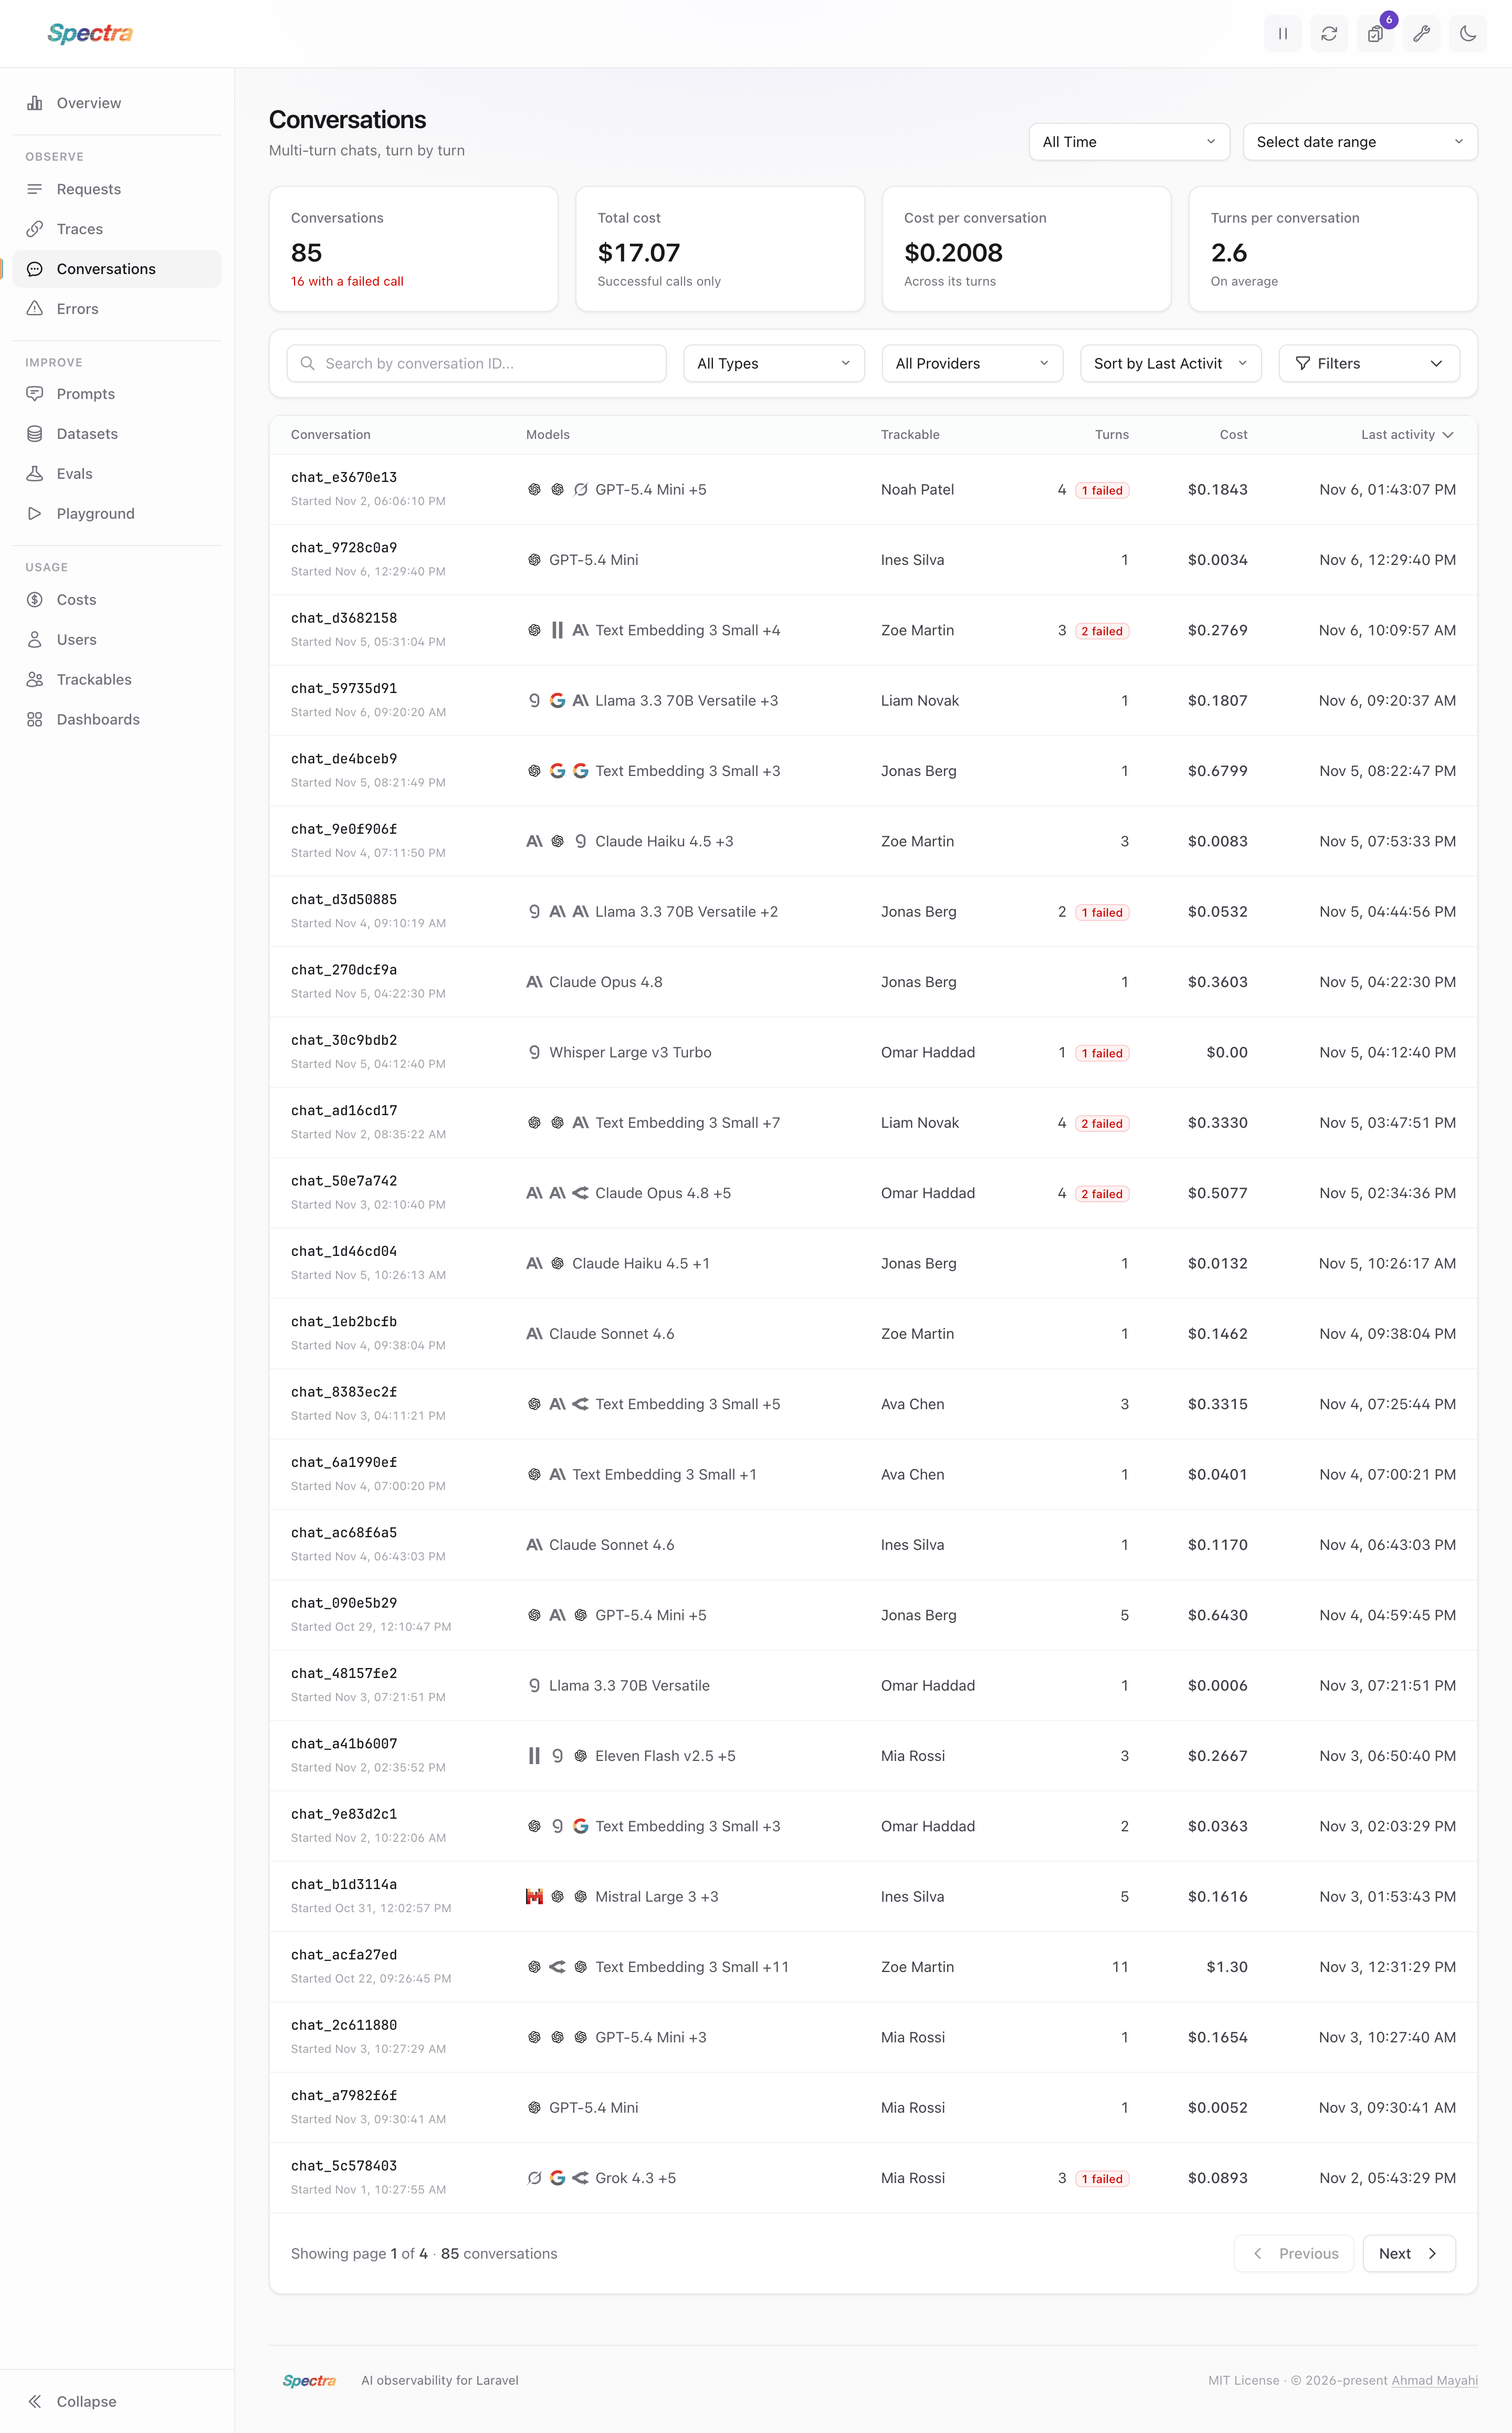
The conversations list shows one row per conversation: its turns and failed calls, the models it used, its trackable, its cost and its last activity.
Conversation Transcript
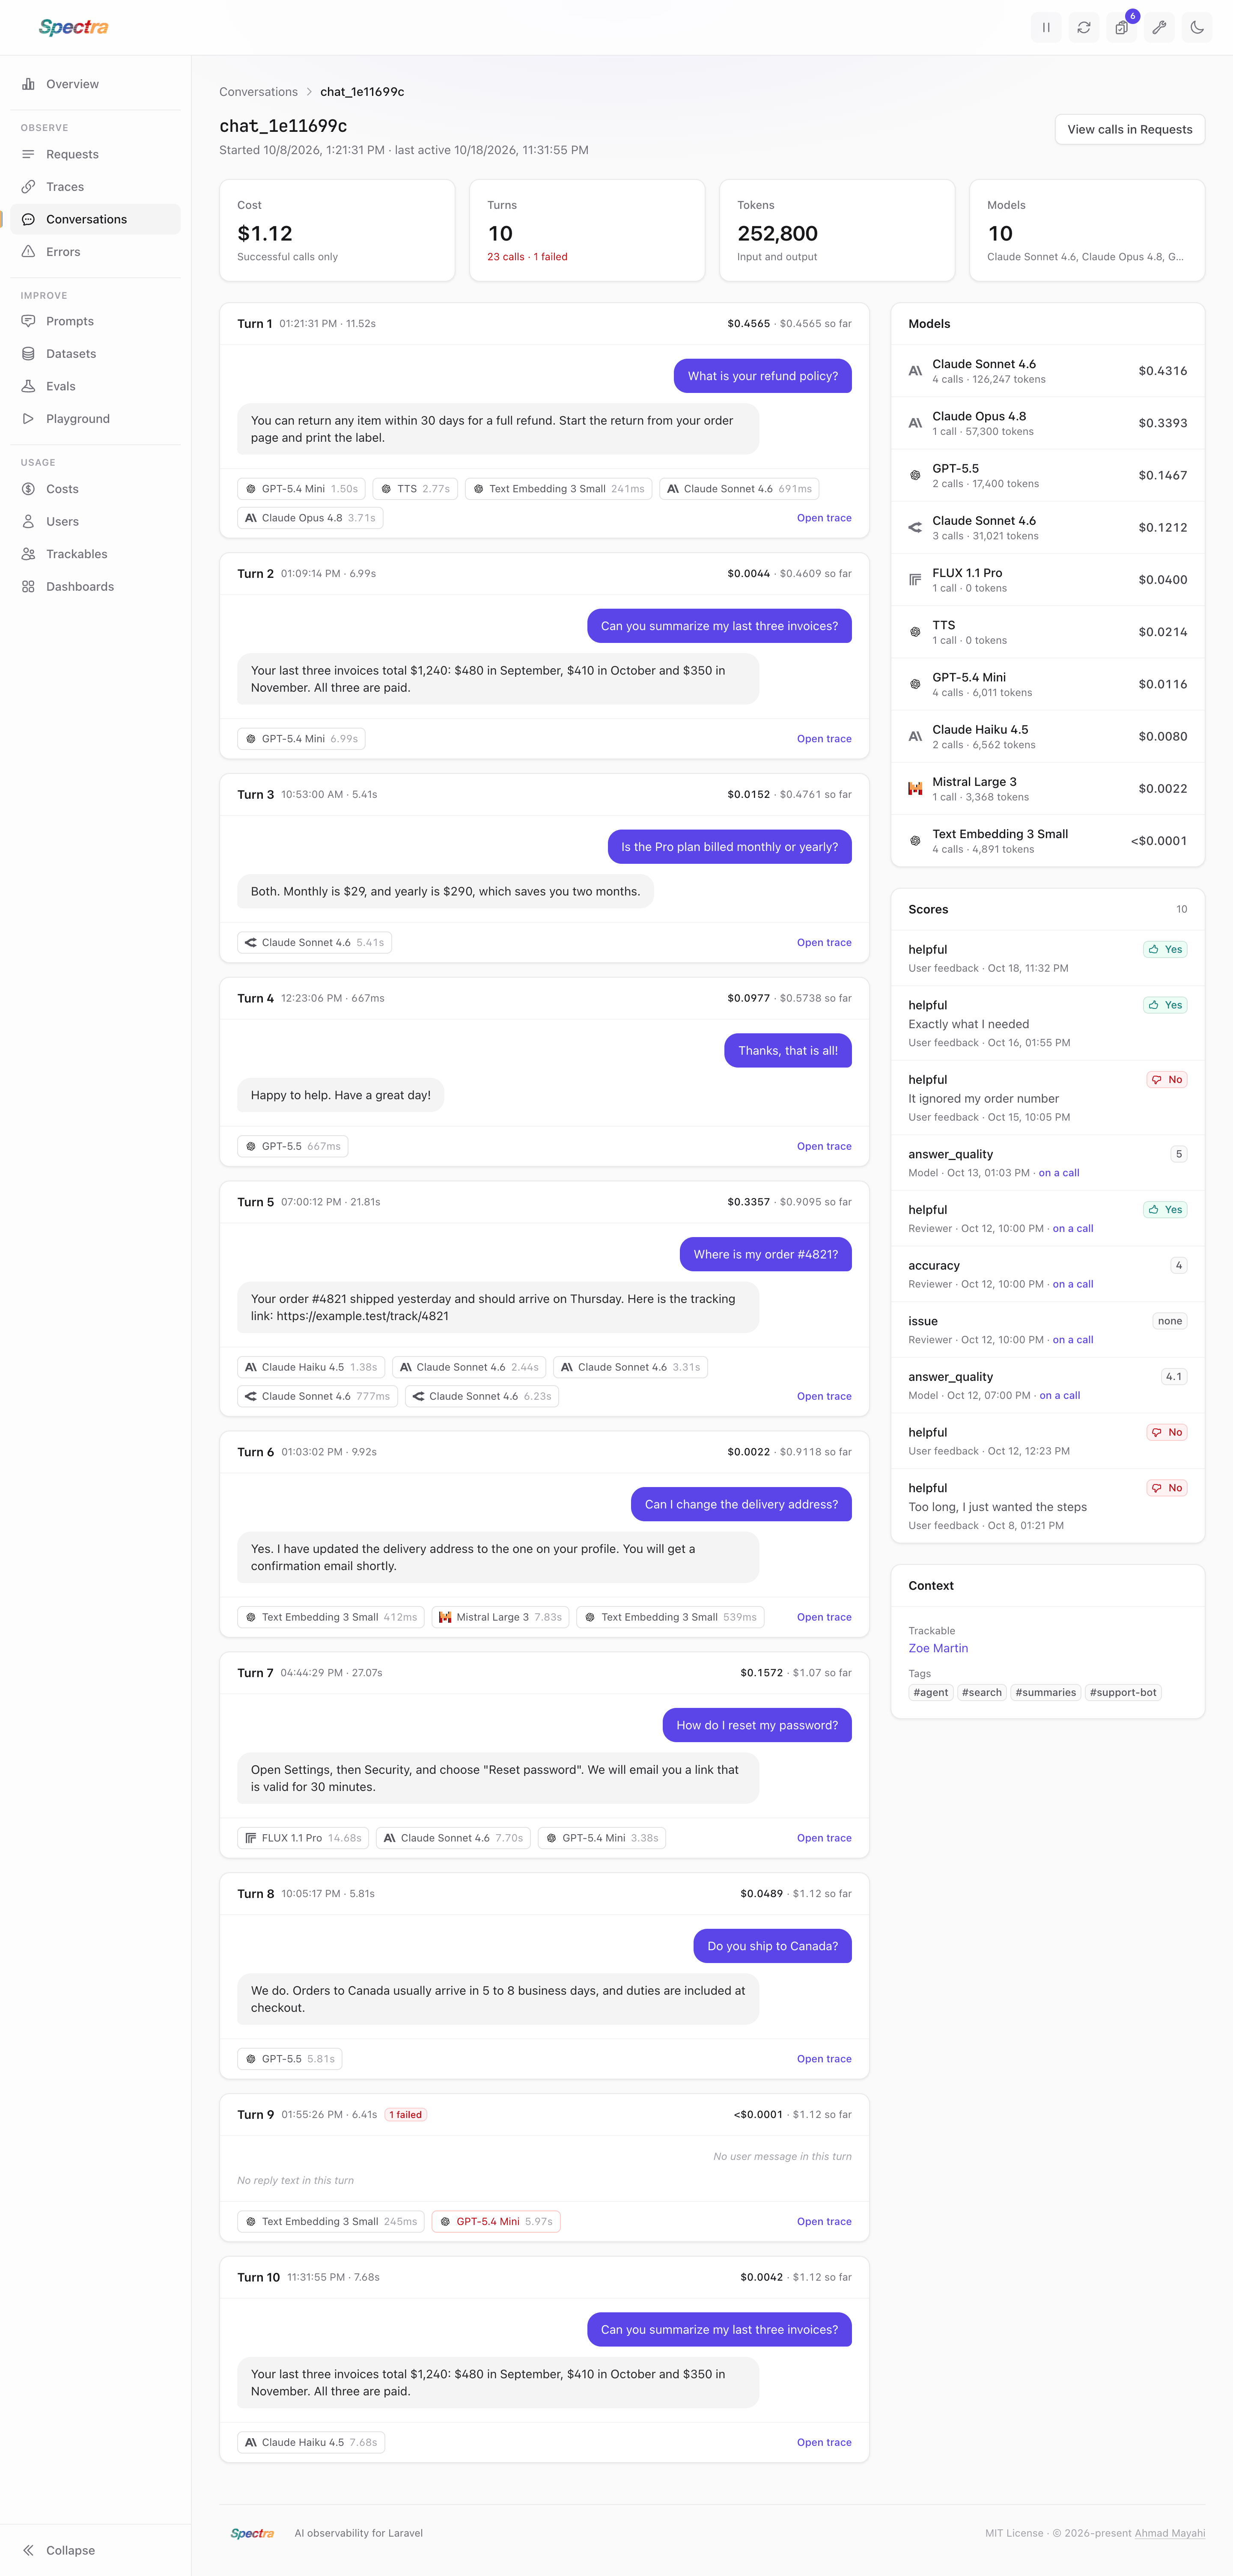
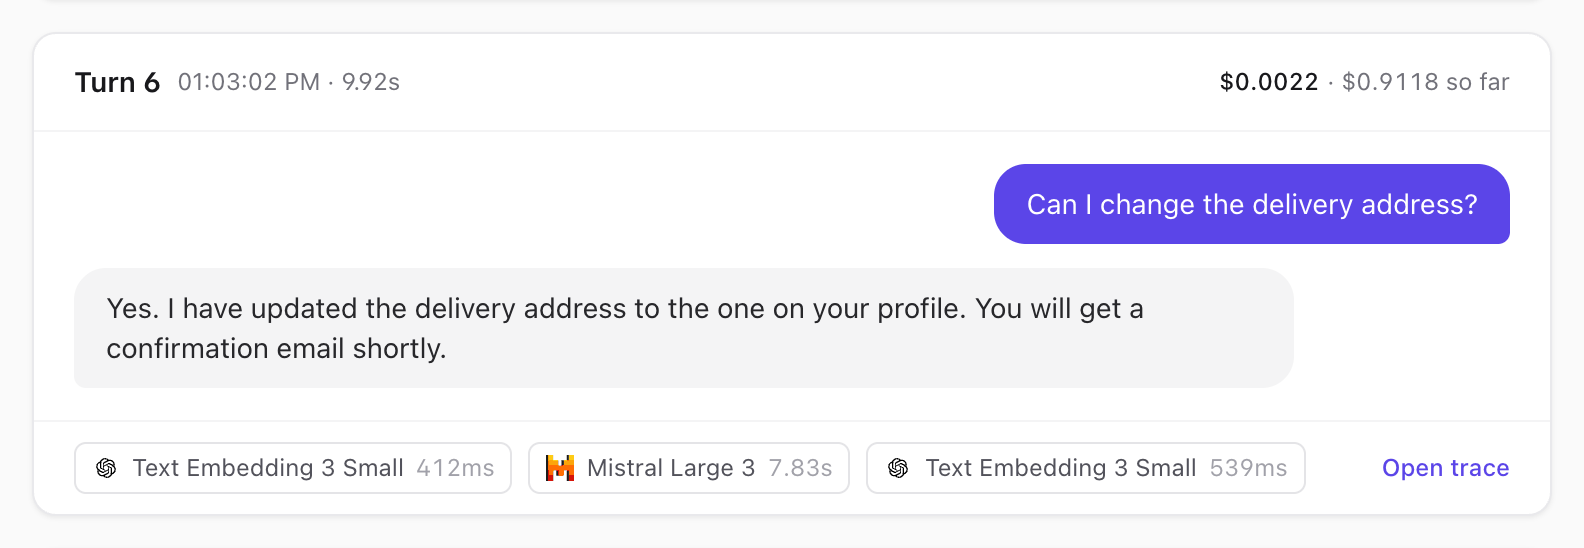
Open a conversation to read it as a transcript. Each turn shows the user's message and the model's reply, the calls the turn made, what the turn cost and what the conversation has cost so far. A failed call is marked in red. The transcript needs store_prompts and store_responses; with either off, the turns still show their calls and costs.
Prompts
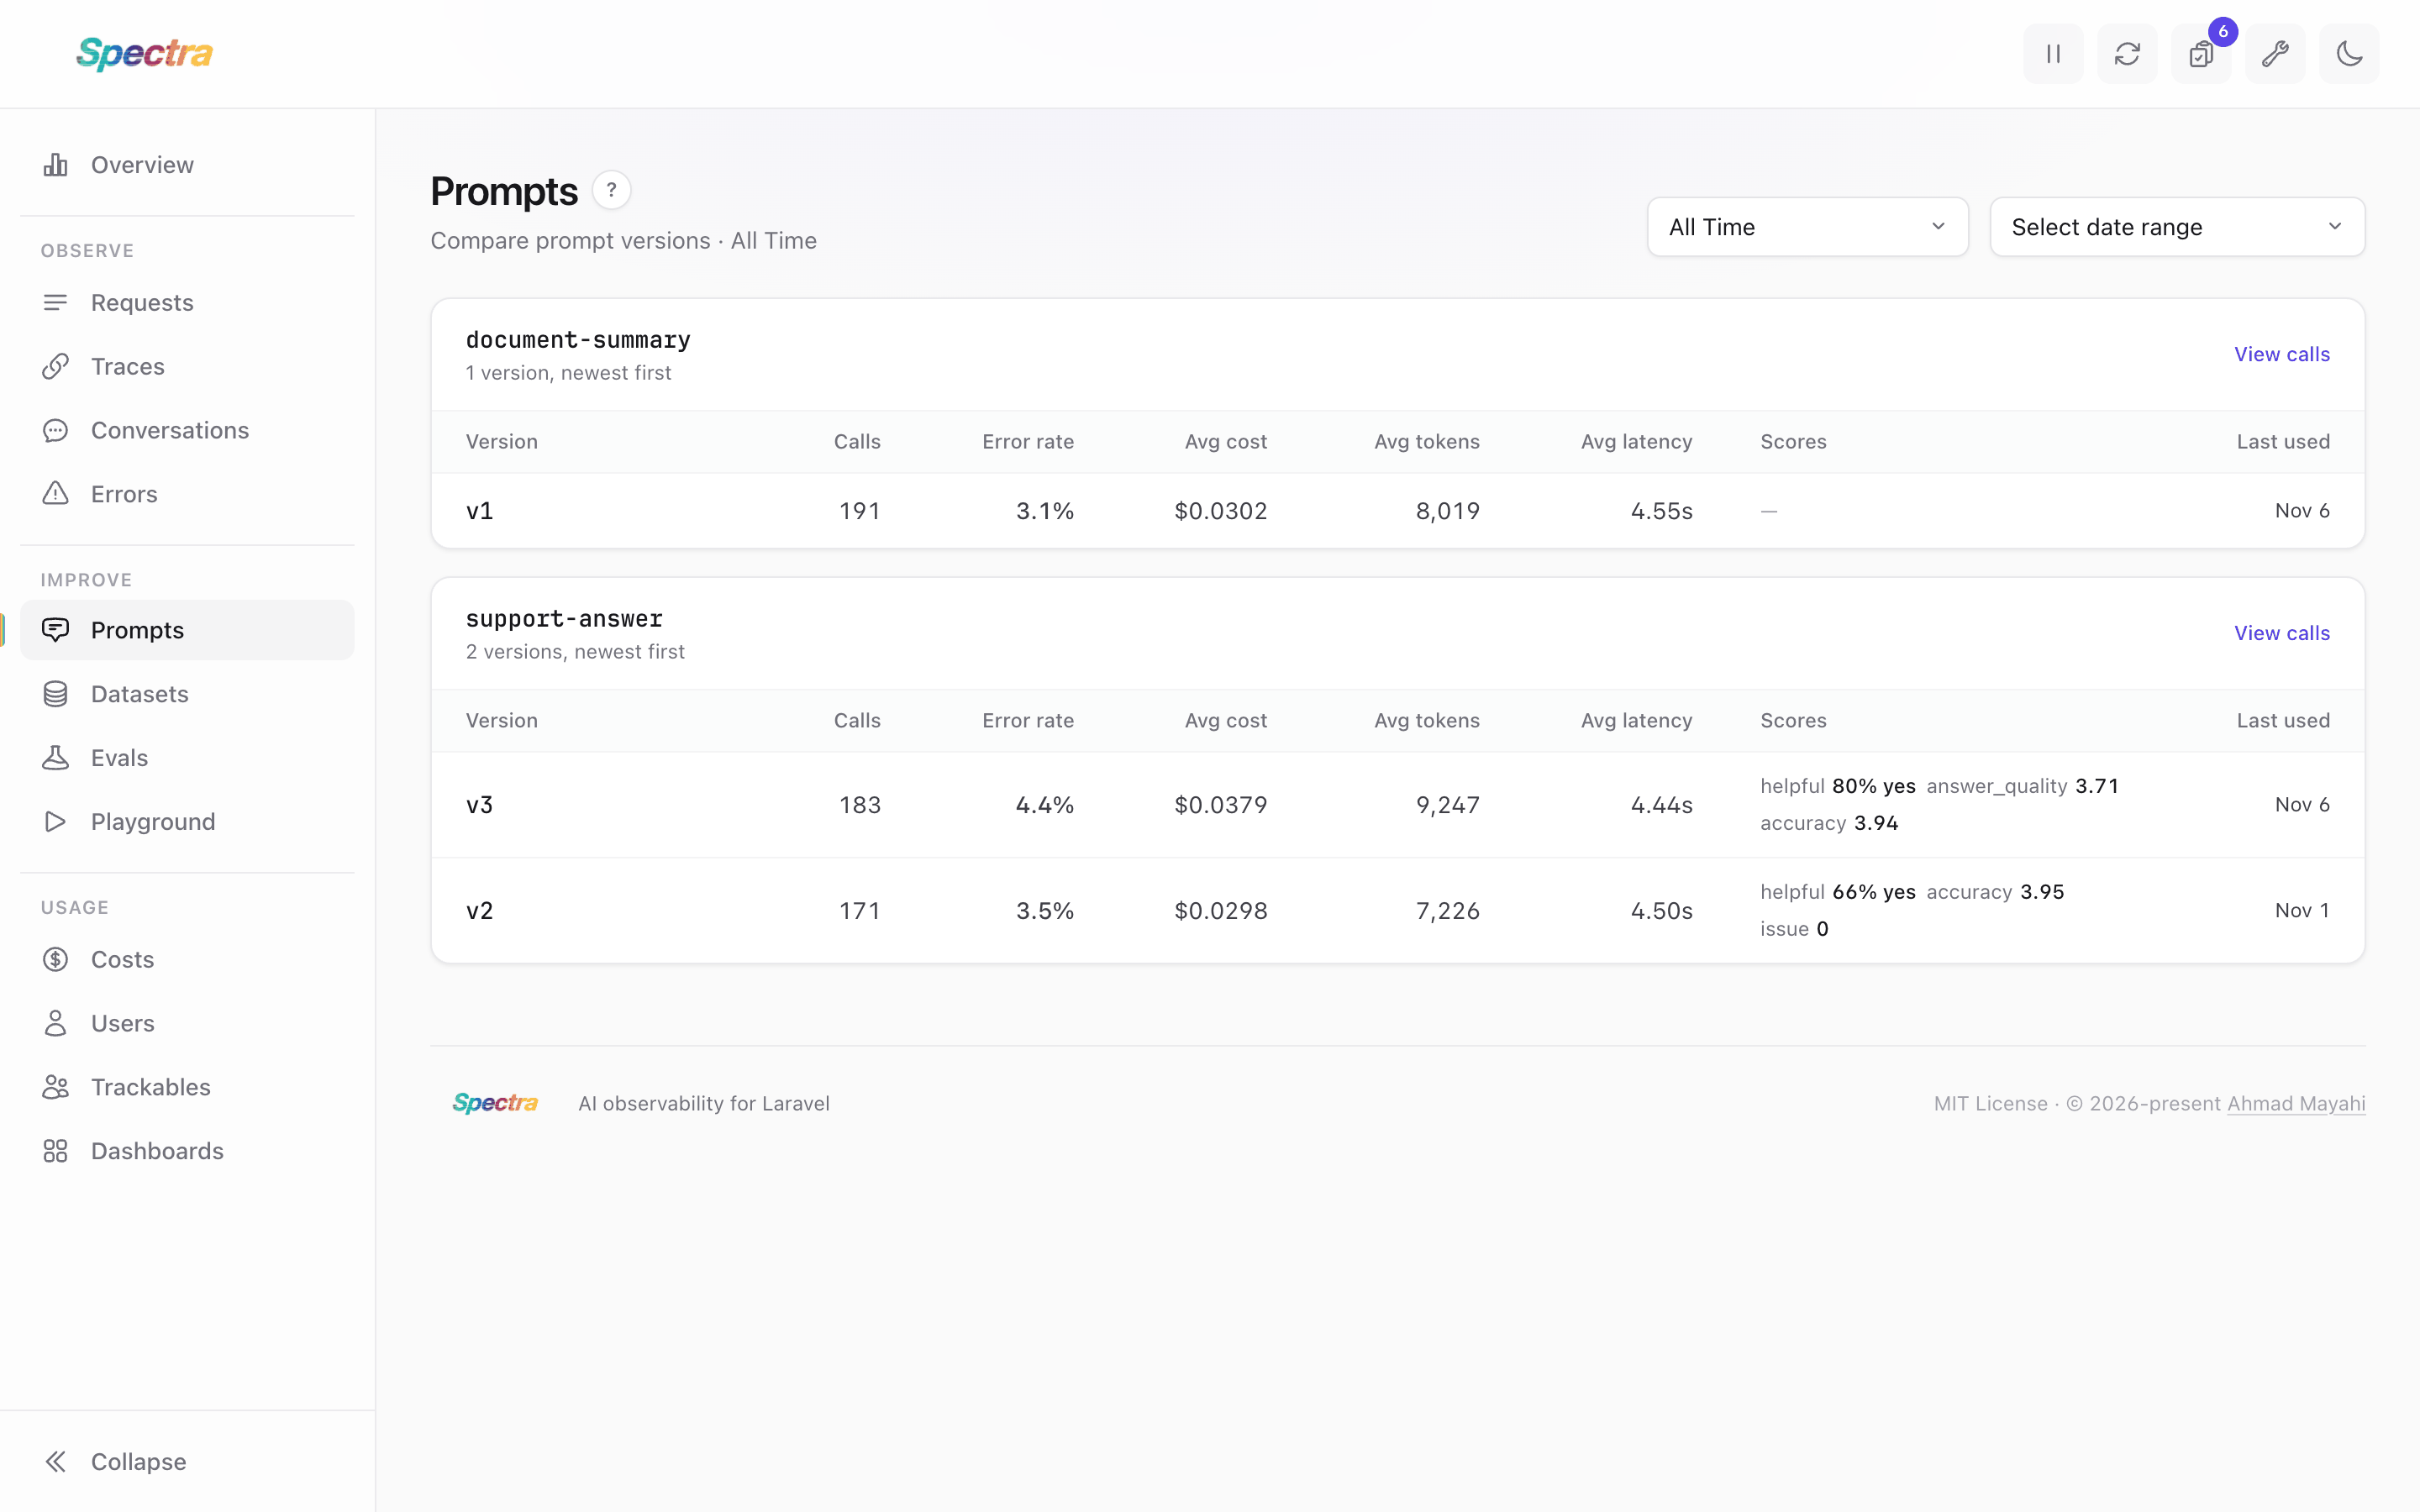
The prompts screen compares the versions of each prompt your calls were tagged with: their calls, error rate, average cost, tokens and latency, their top scores, and when each was last used. Click a version to see its calls. The screen lists the prompts once your app tags calls with Spectra::withPrompt().
Errors
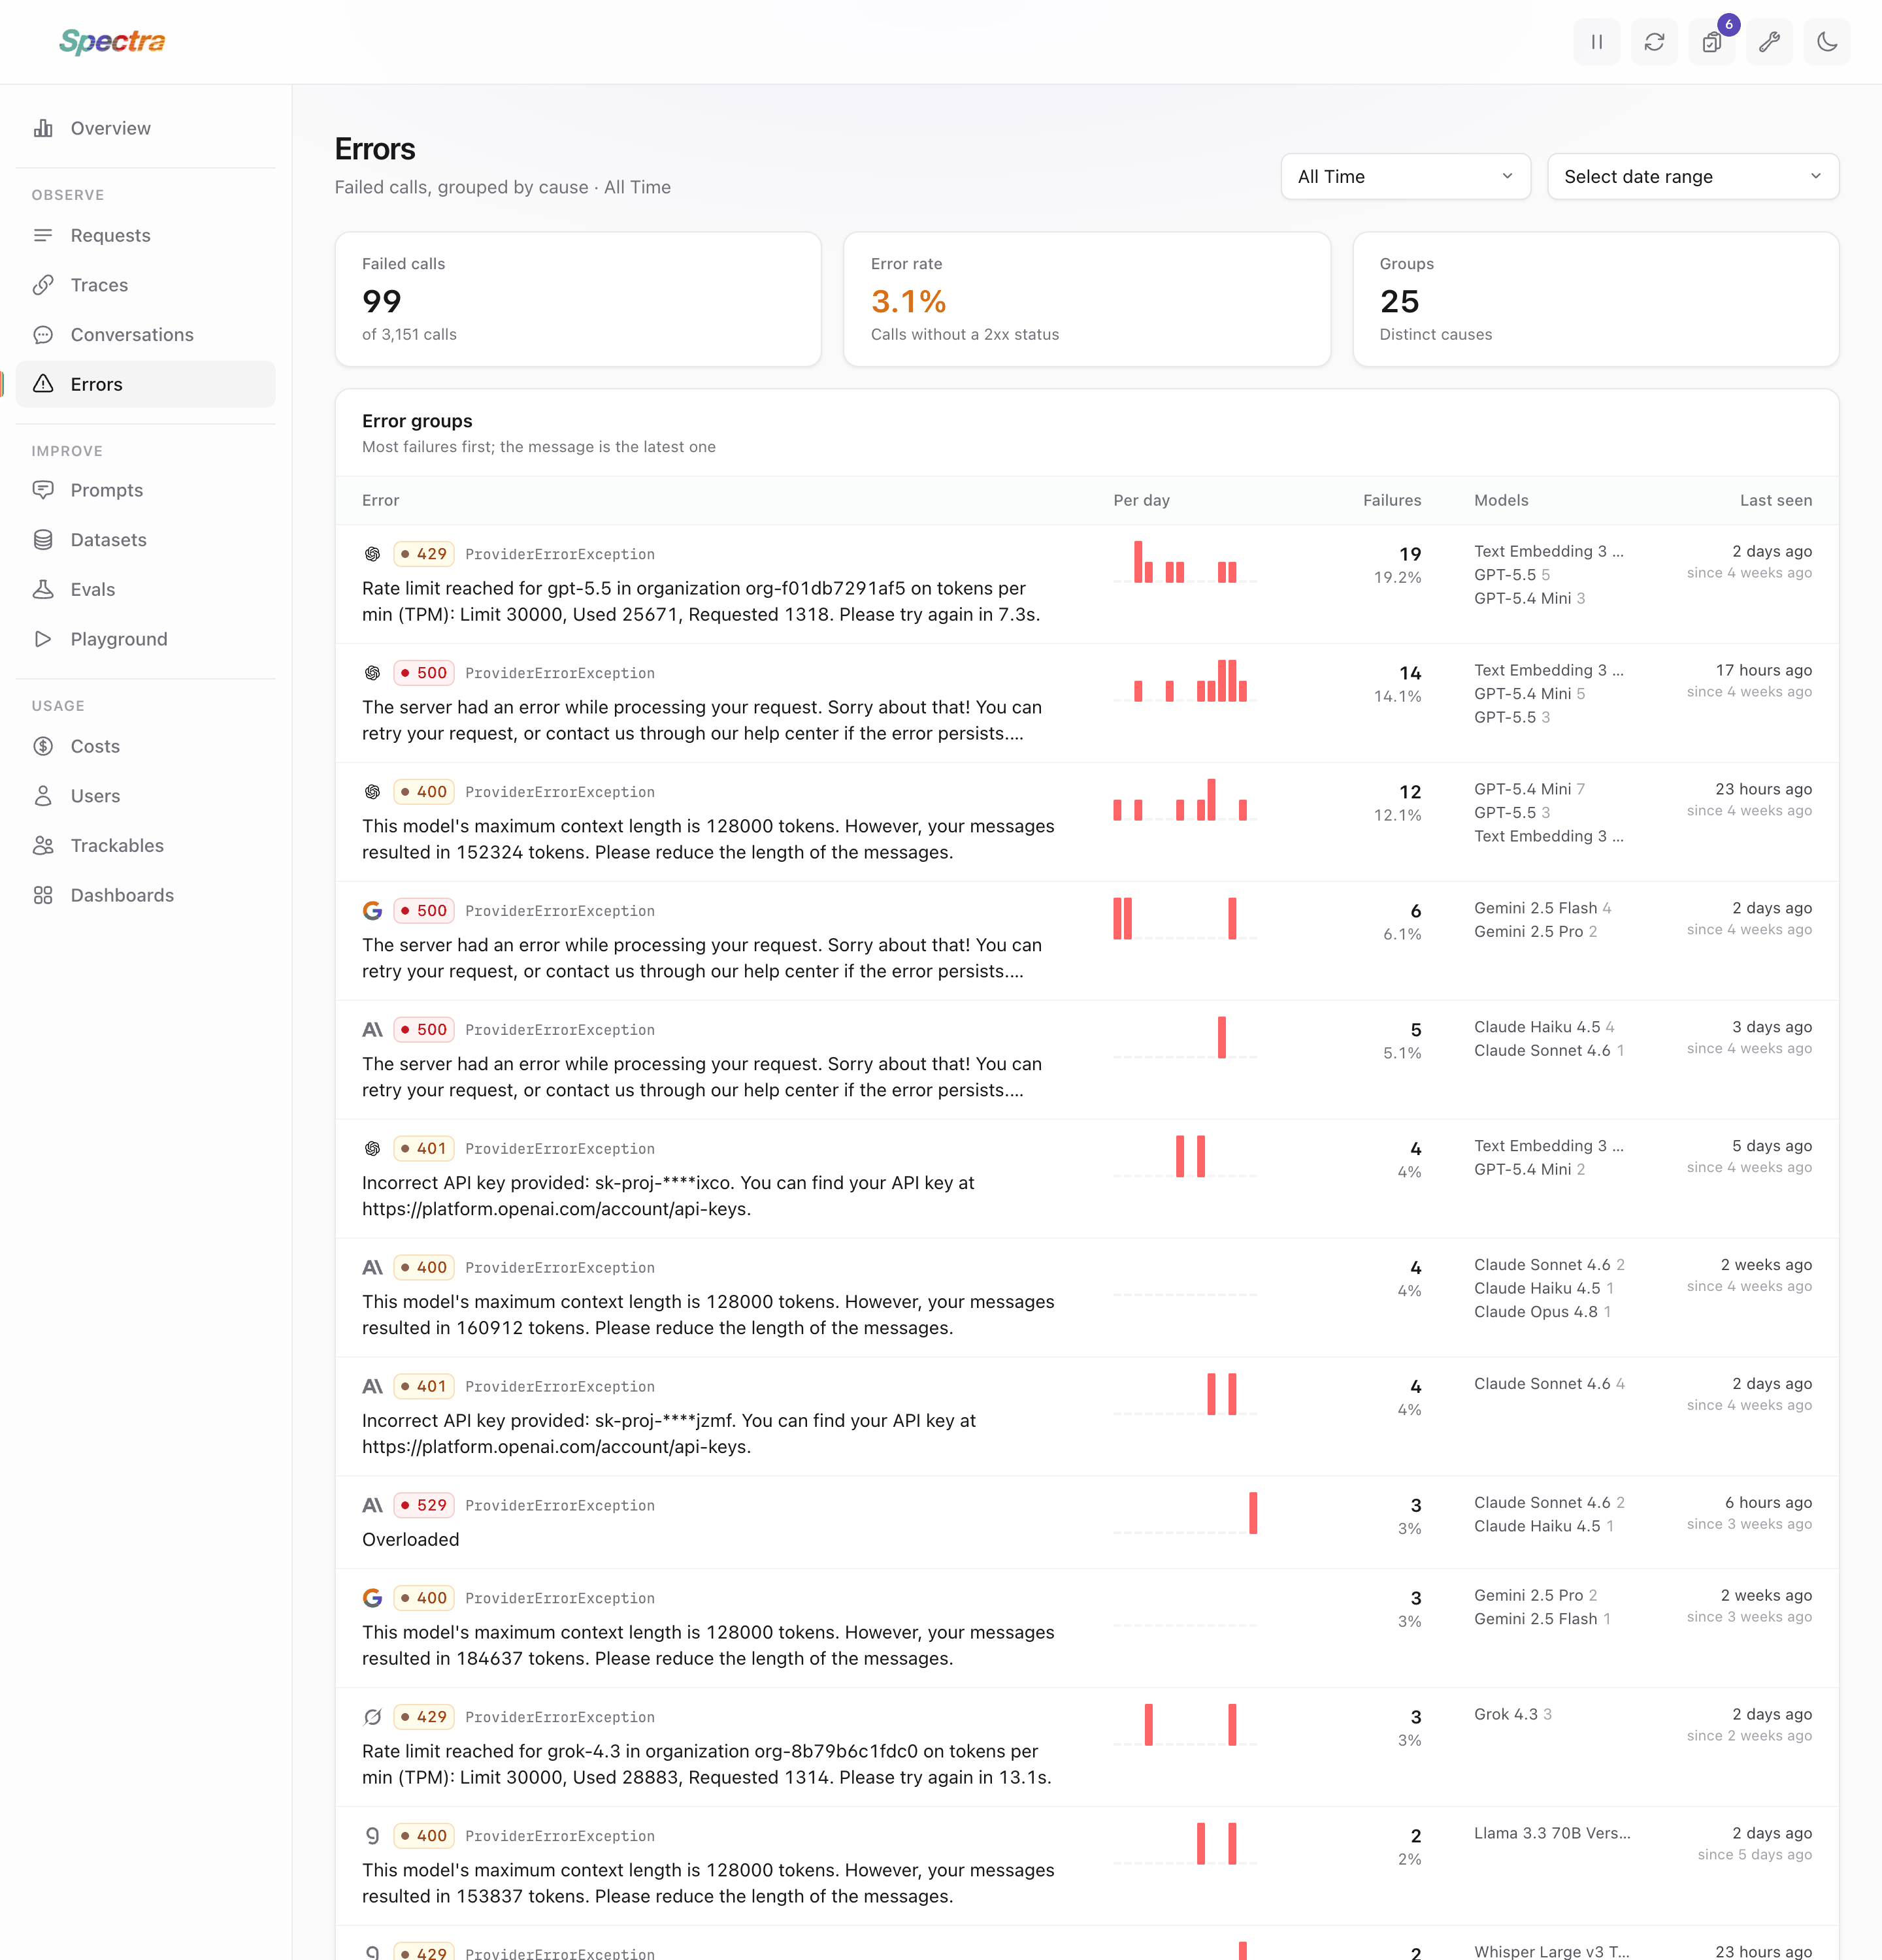
The errors screen groups the period's failed calls by cause, so a rate limit that hit 400 times is one row, not 400. It shows how many calls failed and the error rate, then each group with the most failures first:
- the provider, status code and error type, and the latest message;
- how many calls failed this way, and their share of all failures;
- failures per day over the last 14 days of the period;
- the models it hit, and when it was first and last seen.
Click a group to see its calls in the requests list, or its last-seen time to open the latest one. A failed call's page links to the calls that failed the same way.
Two failures are in the same group when they have the same provider, status code and error type, and the same message once the parts that change from call to call are taken out: ids, numbers, URLs, emails, IP addresses, masked keys and the model's name. "Rate limit reached for gpt-4o … try again in 2s" and "Rate limit reached for gpt-4o-mini … try again in 14s" are one group. A call counts as failed when it got no 2xx status, or when the provider reported an error inside a 2xx answer (a job that ended failed, a stream that broke off); the status badge of such a call is red although it reads 200.
Failures saved before the error fingerprint migration aren't grouped until you run spectra:group-errors; the screen says how many there are.
Review
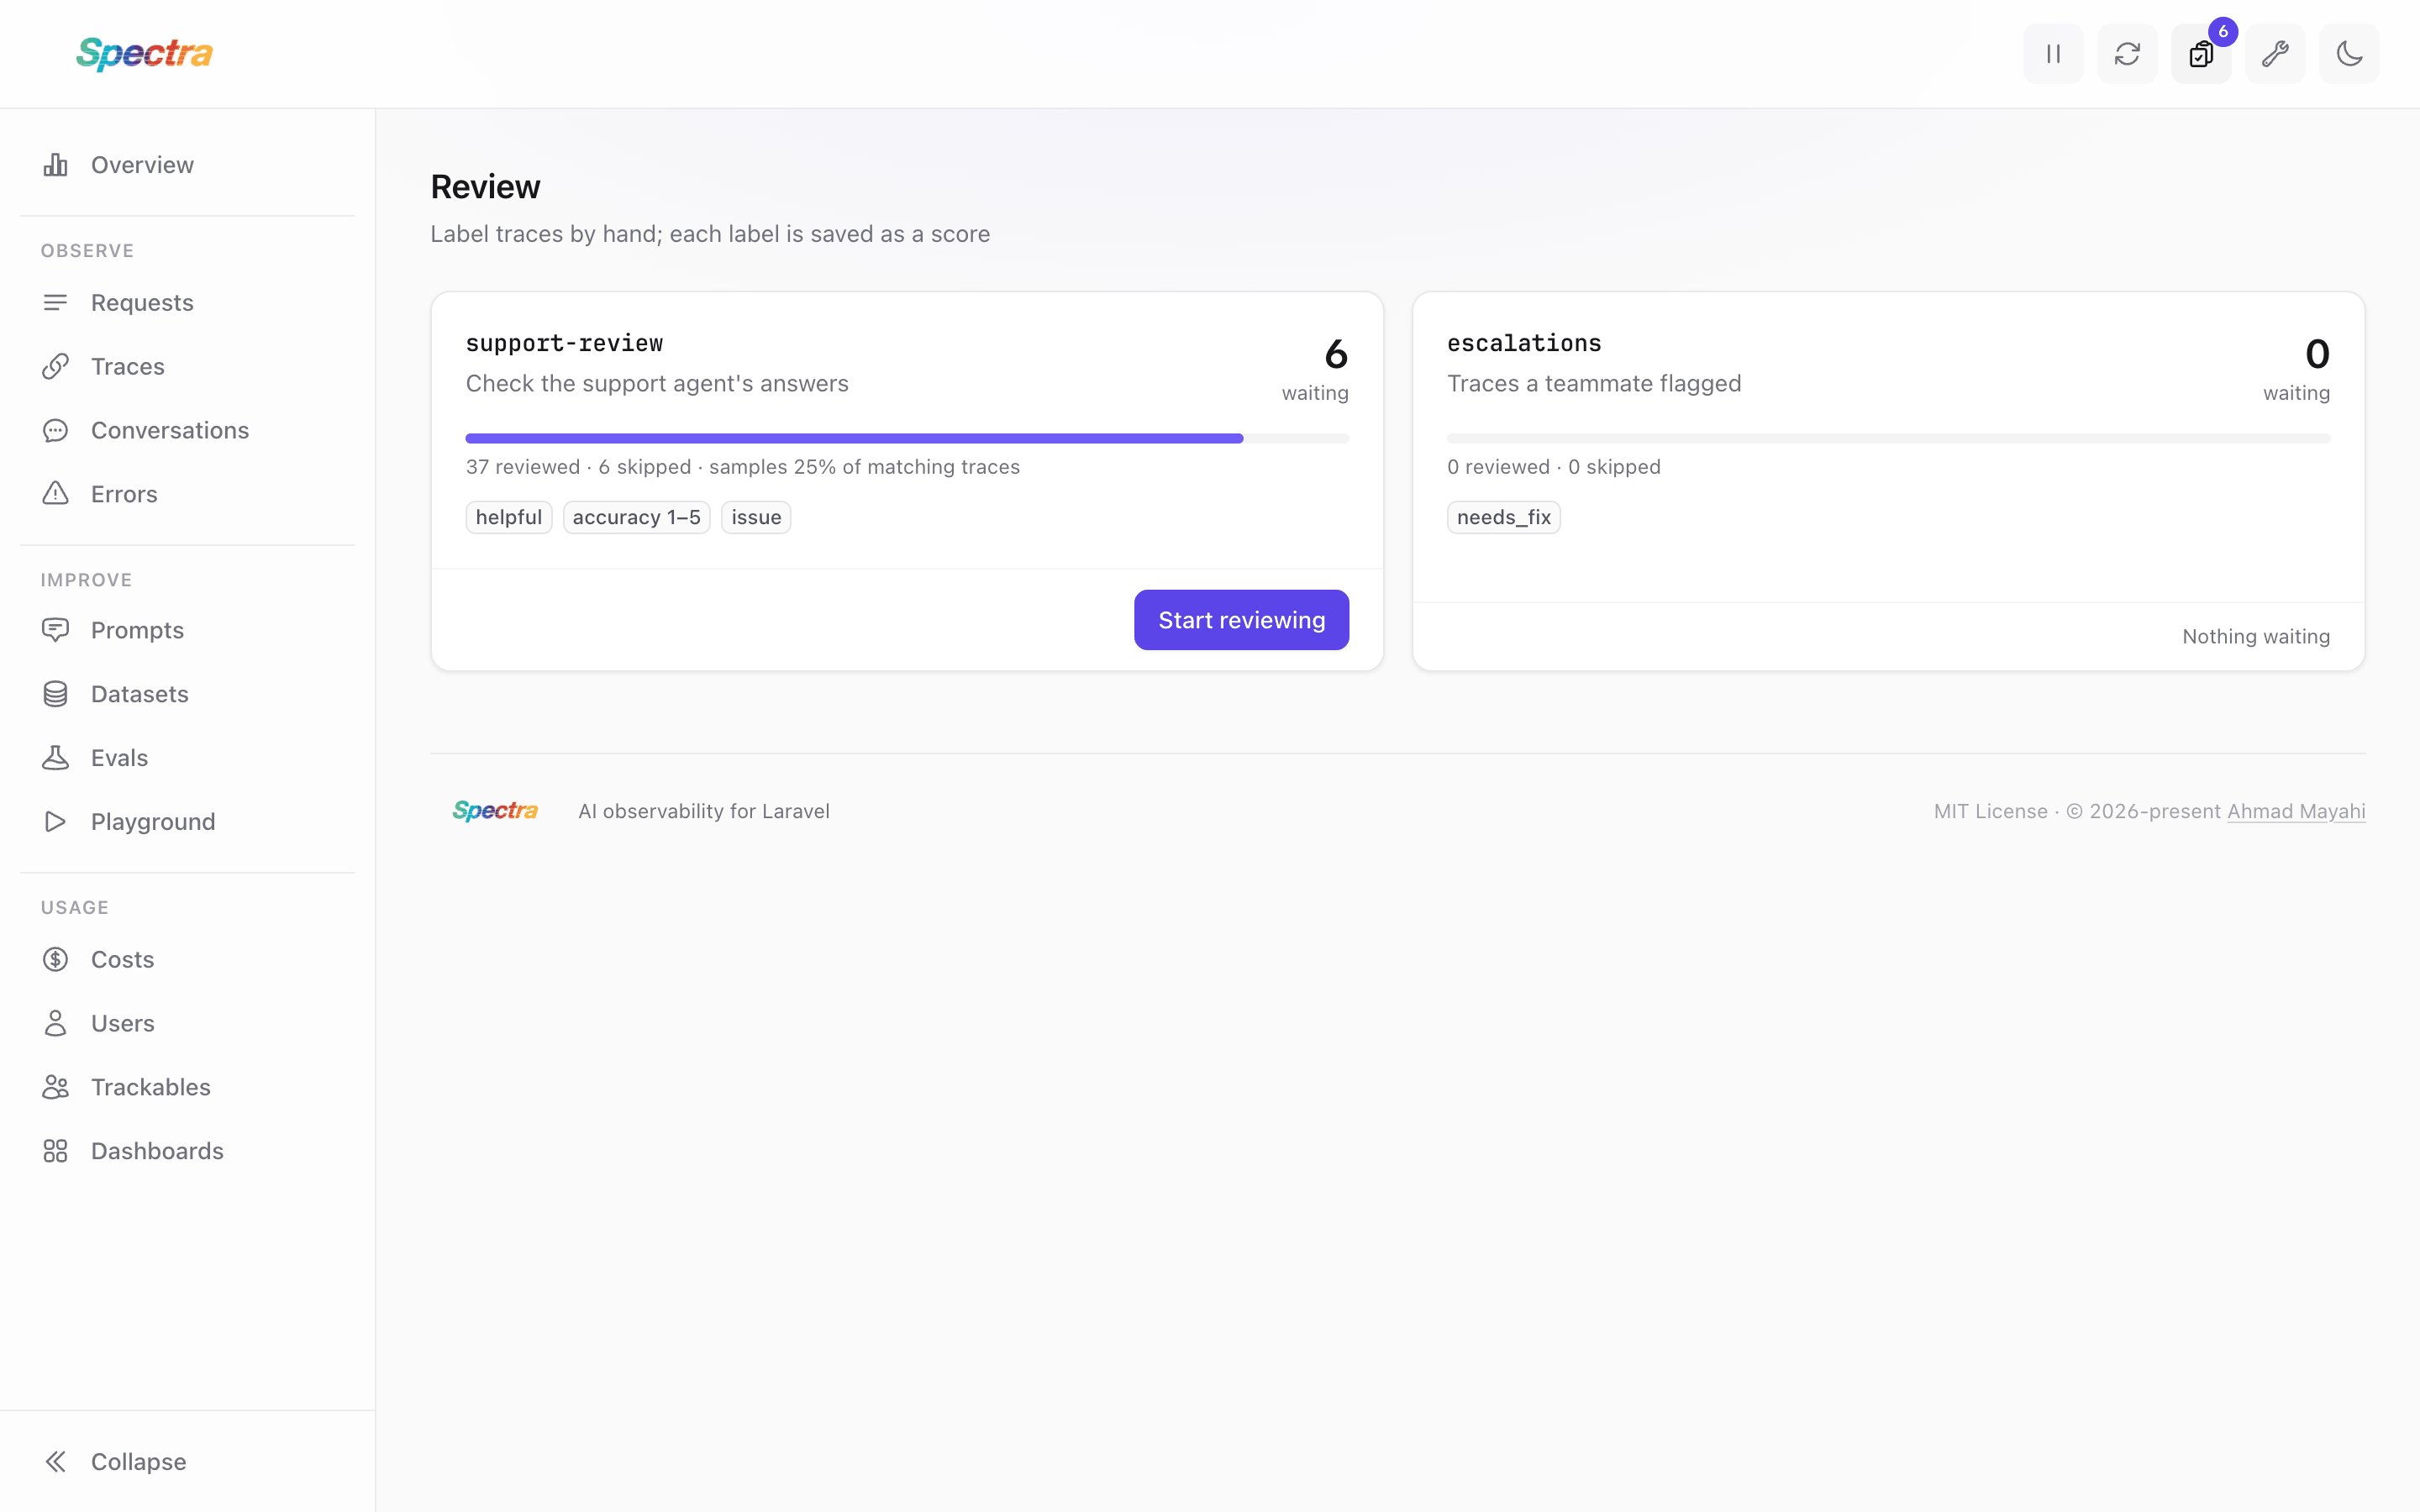
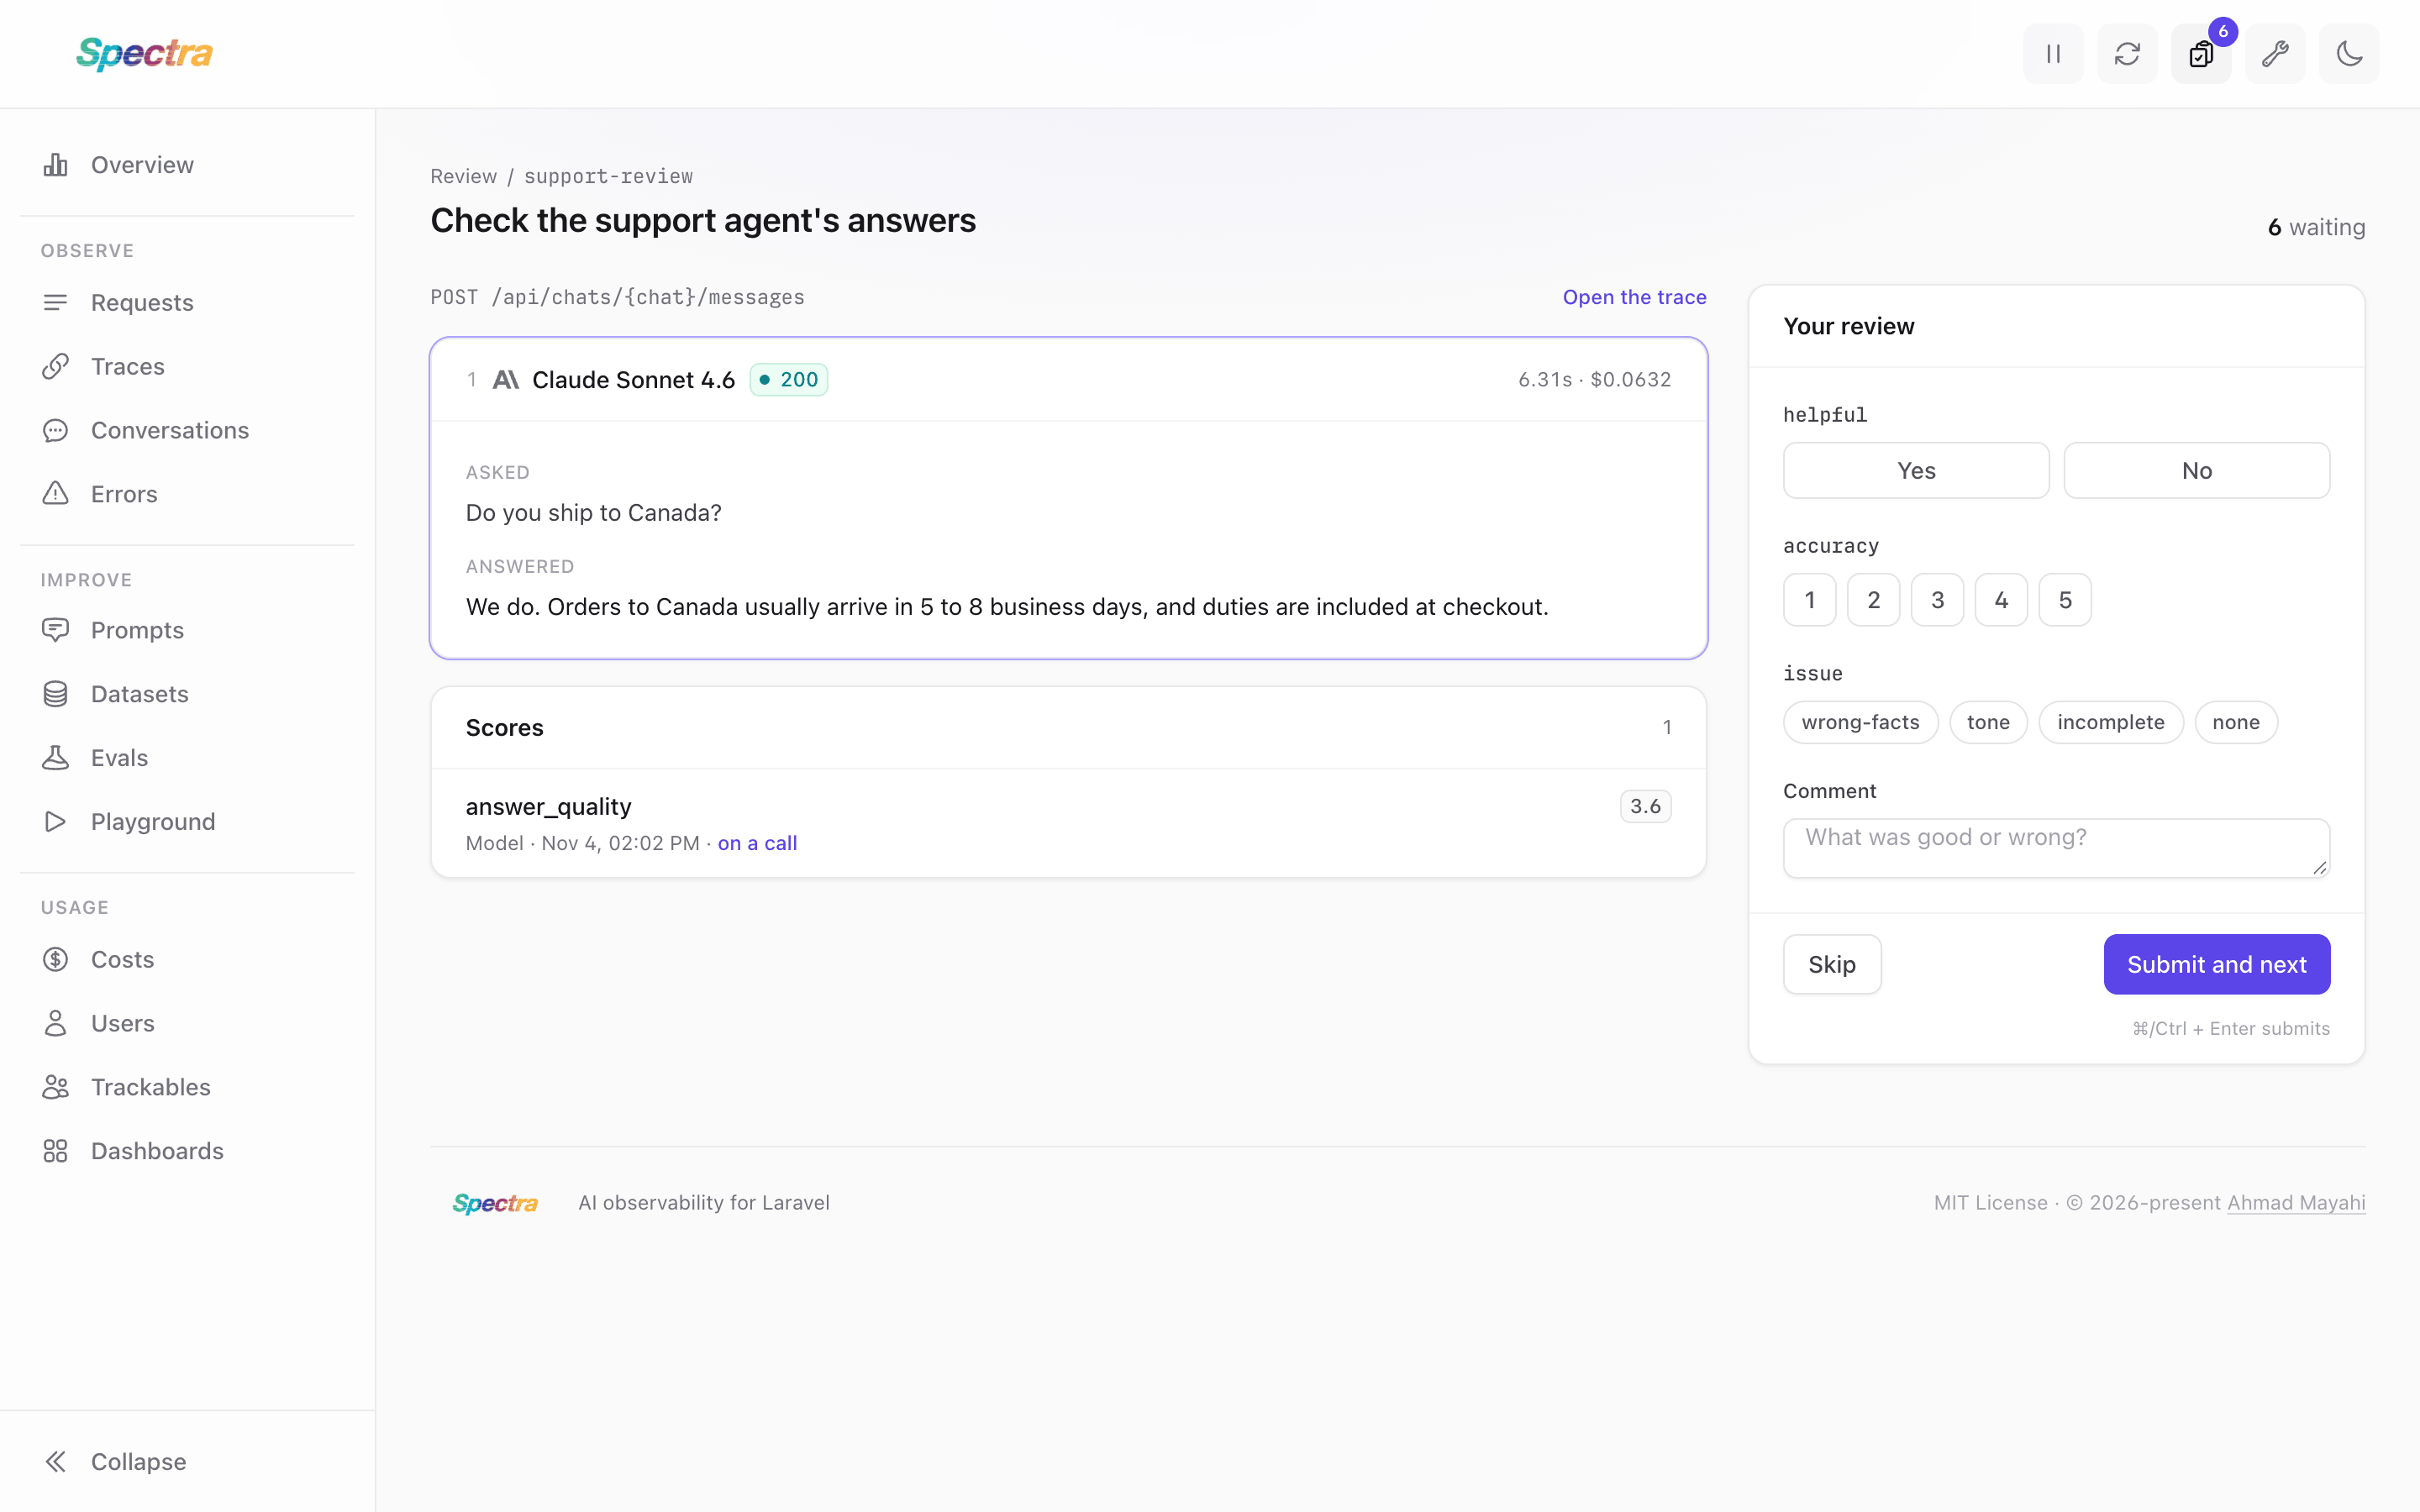
Once the app configures an annotation queue, a clipboard icon in the top bar opens the Review screen, with the number of traces waiting. It lists each queue with its progress; open one to read a trace's calls, give the queue's scores, and move to the next. A trace's page has an Add to review menu to queue it by hand.
Evals
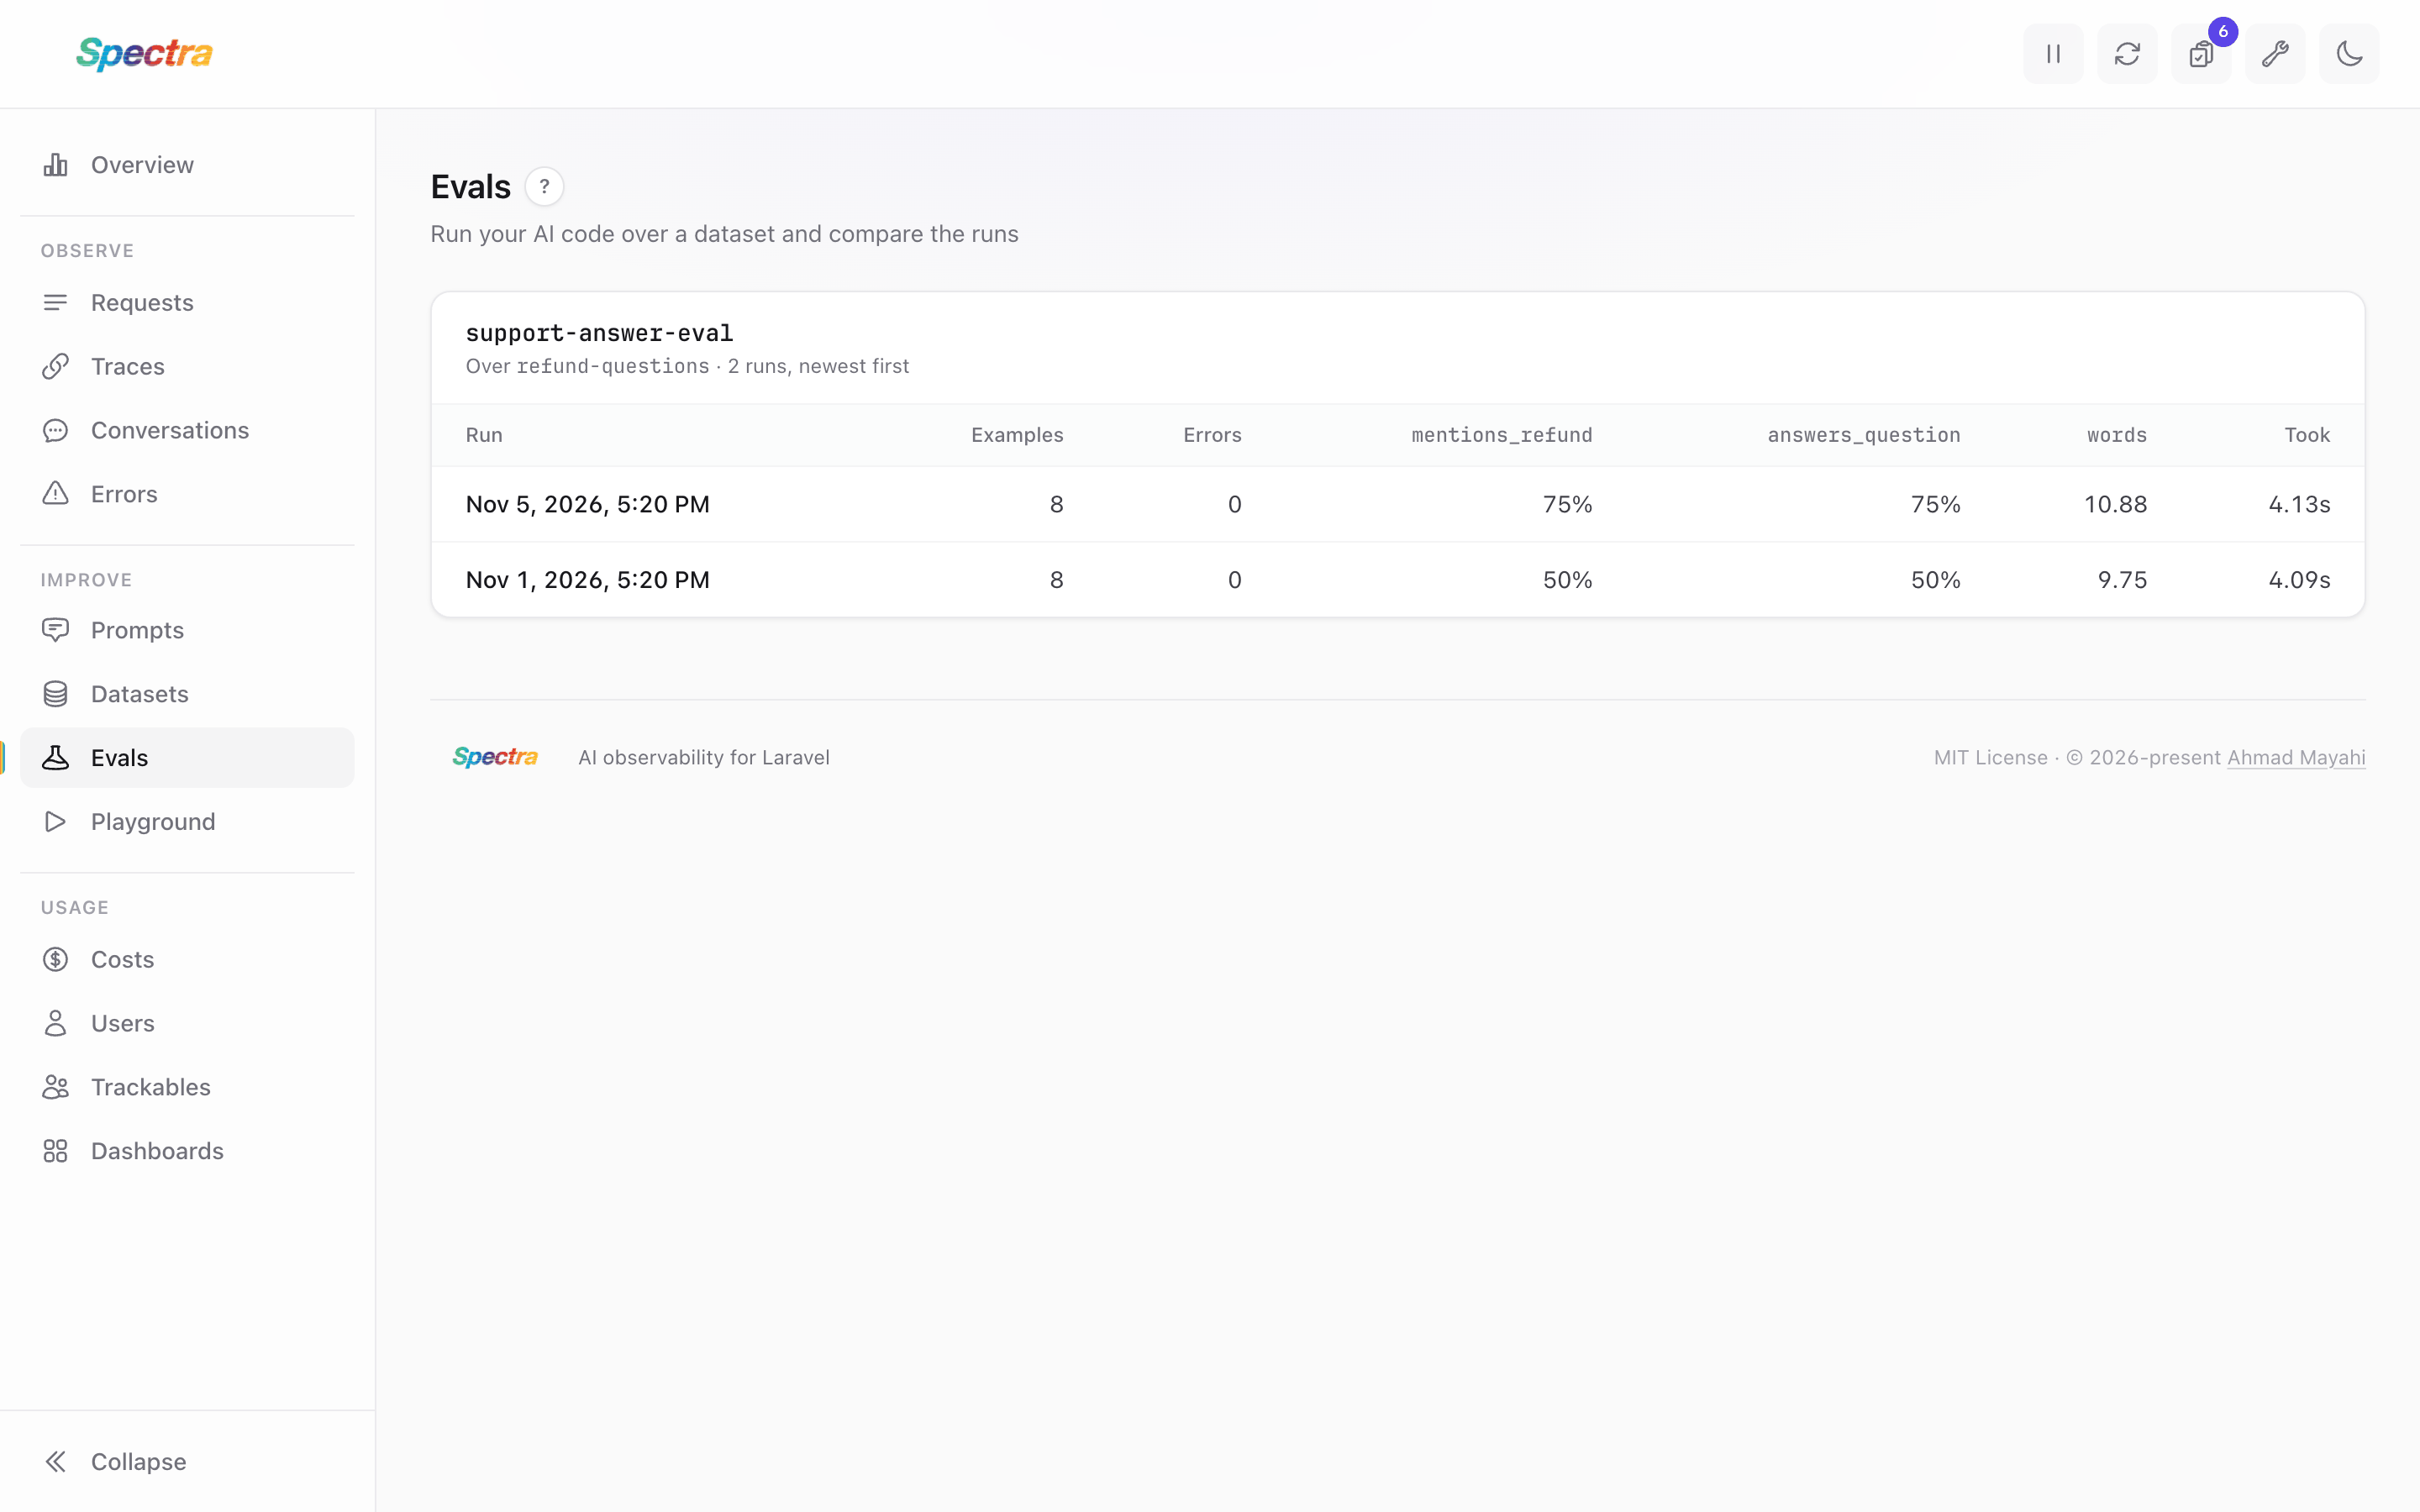
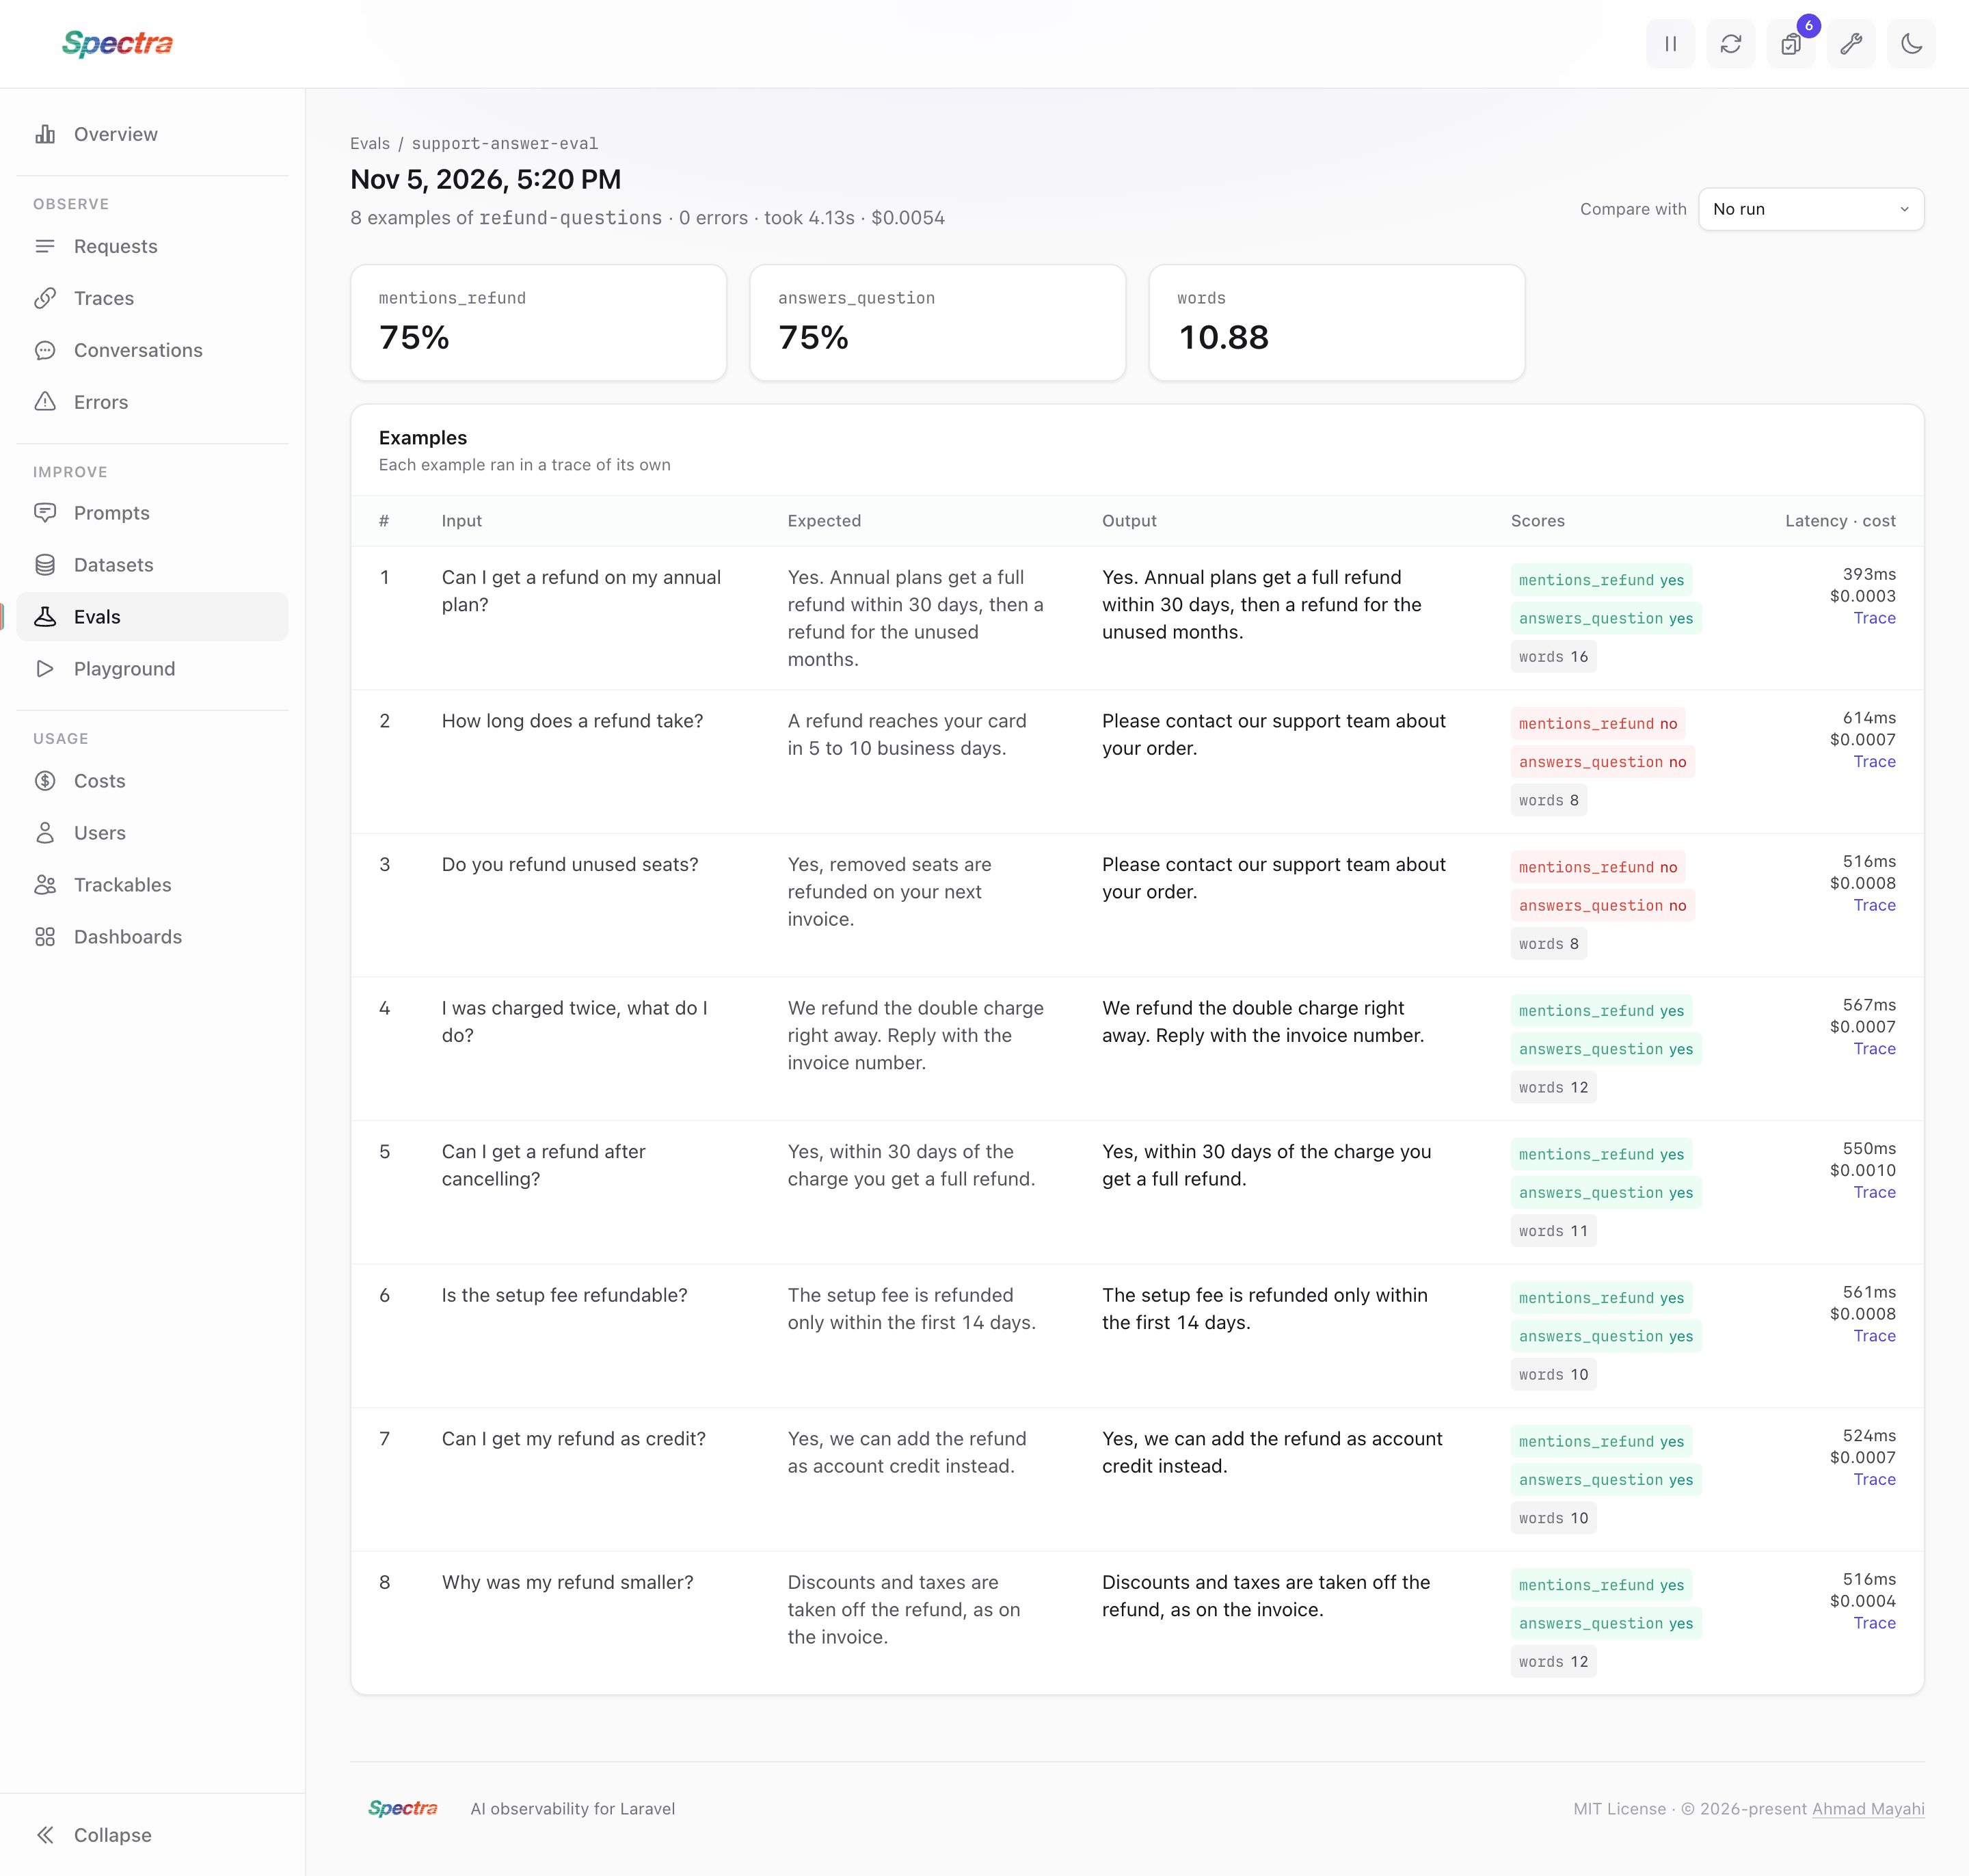
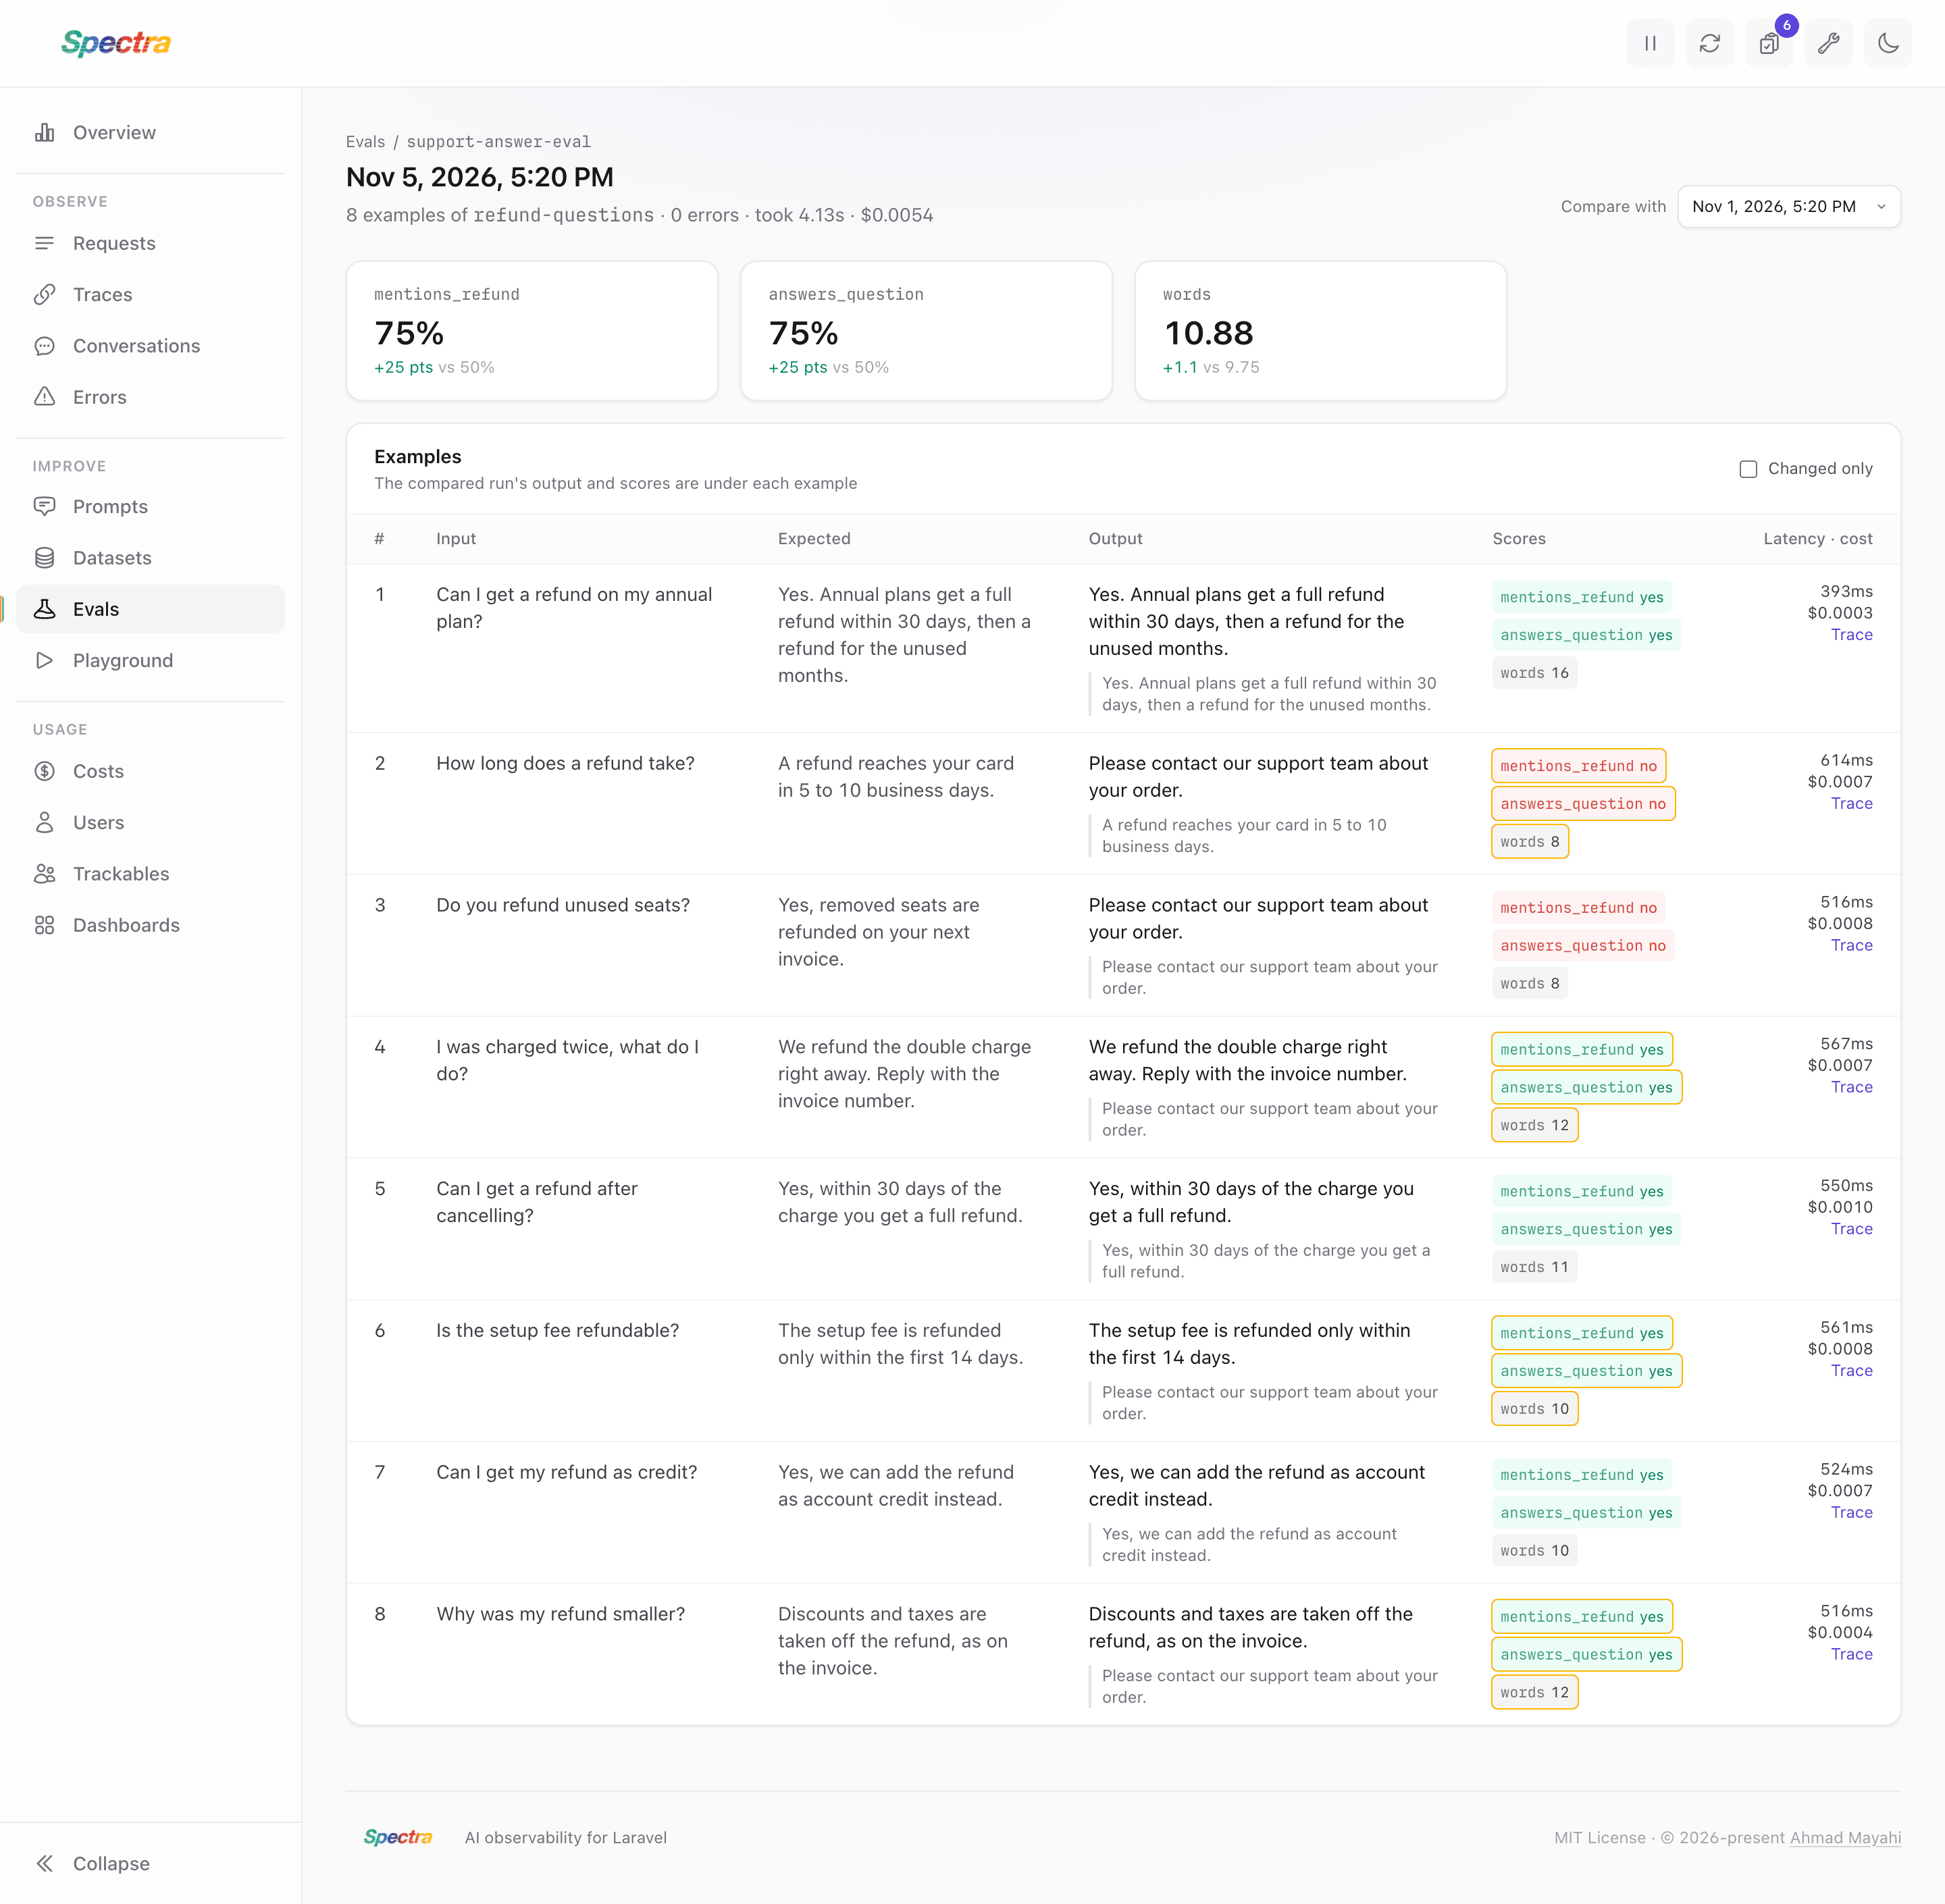
The Evals screen lists each evaluation with its latest runs and every scorer's result per run. Open a run to see each example's input, expected output, output, scores, latency and cost:
Pick an earlier run in Compare with to see how each score moved, with the earlier run's output and scores under each example. Changed only hides the examples whose output and scores stayed the same:
Datasets
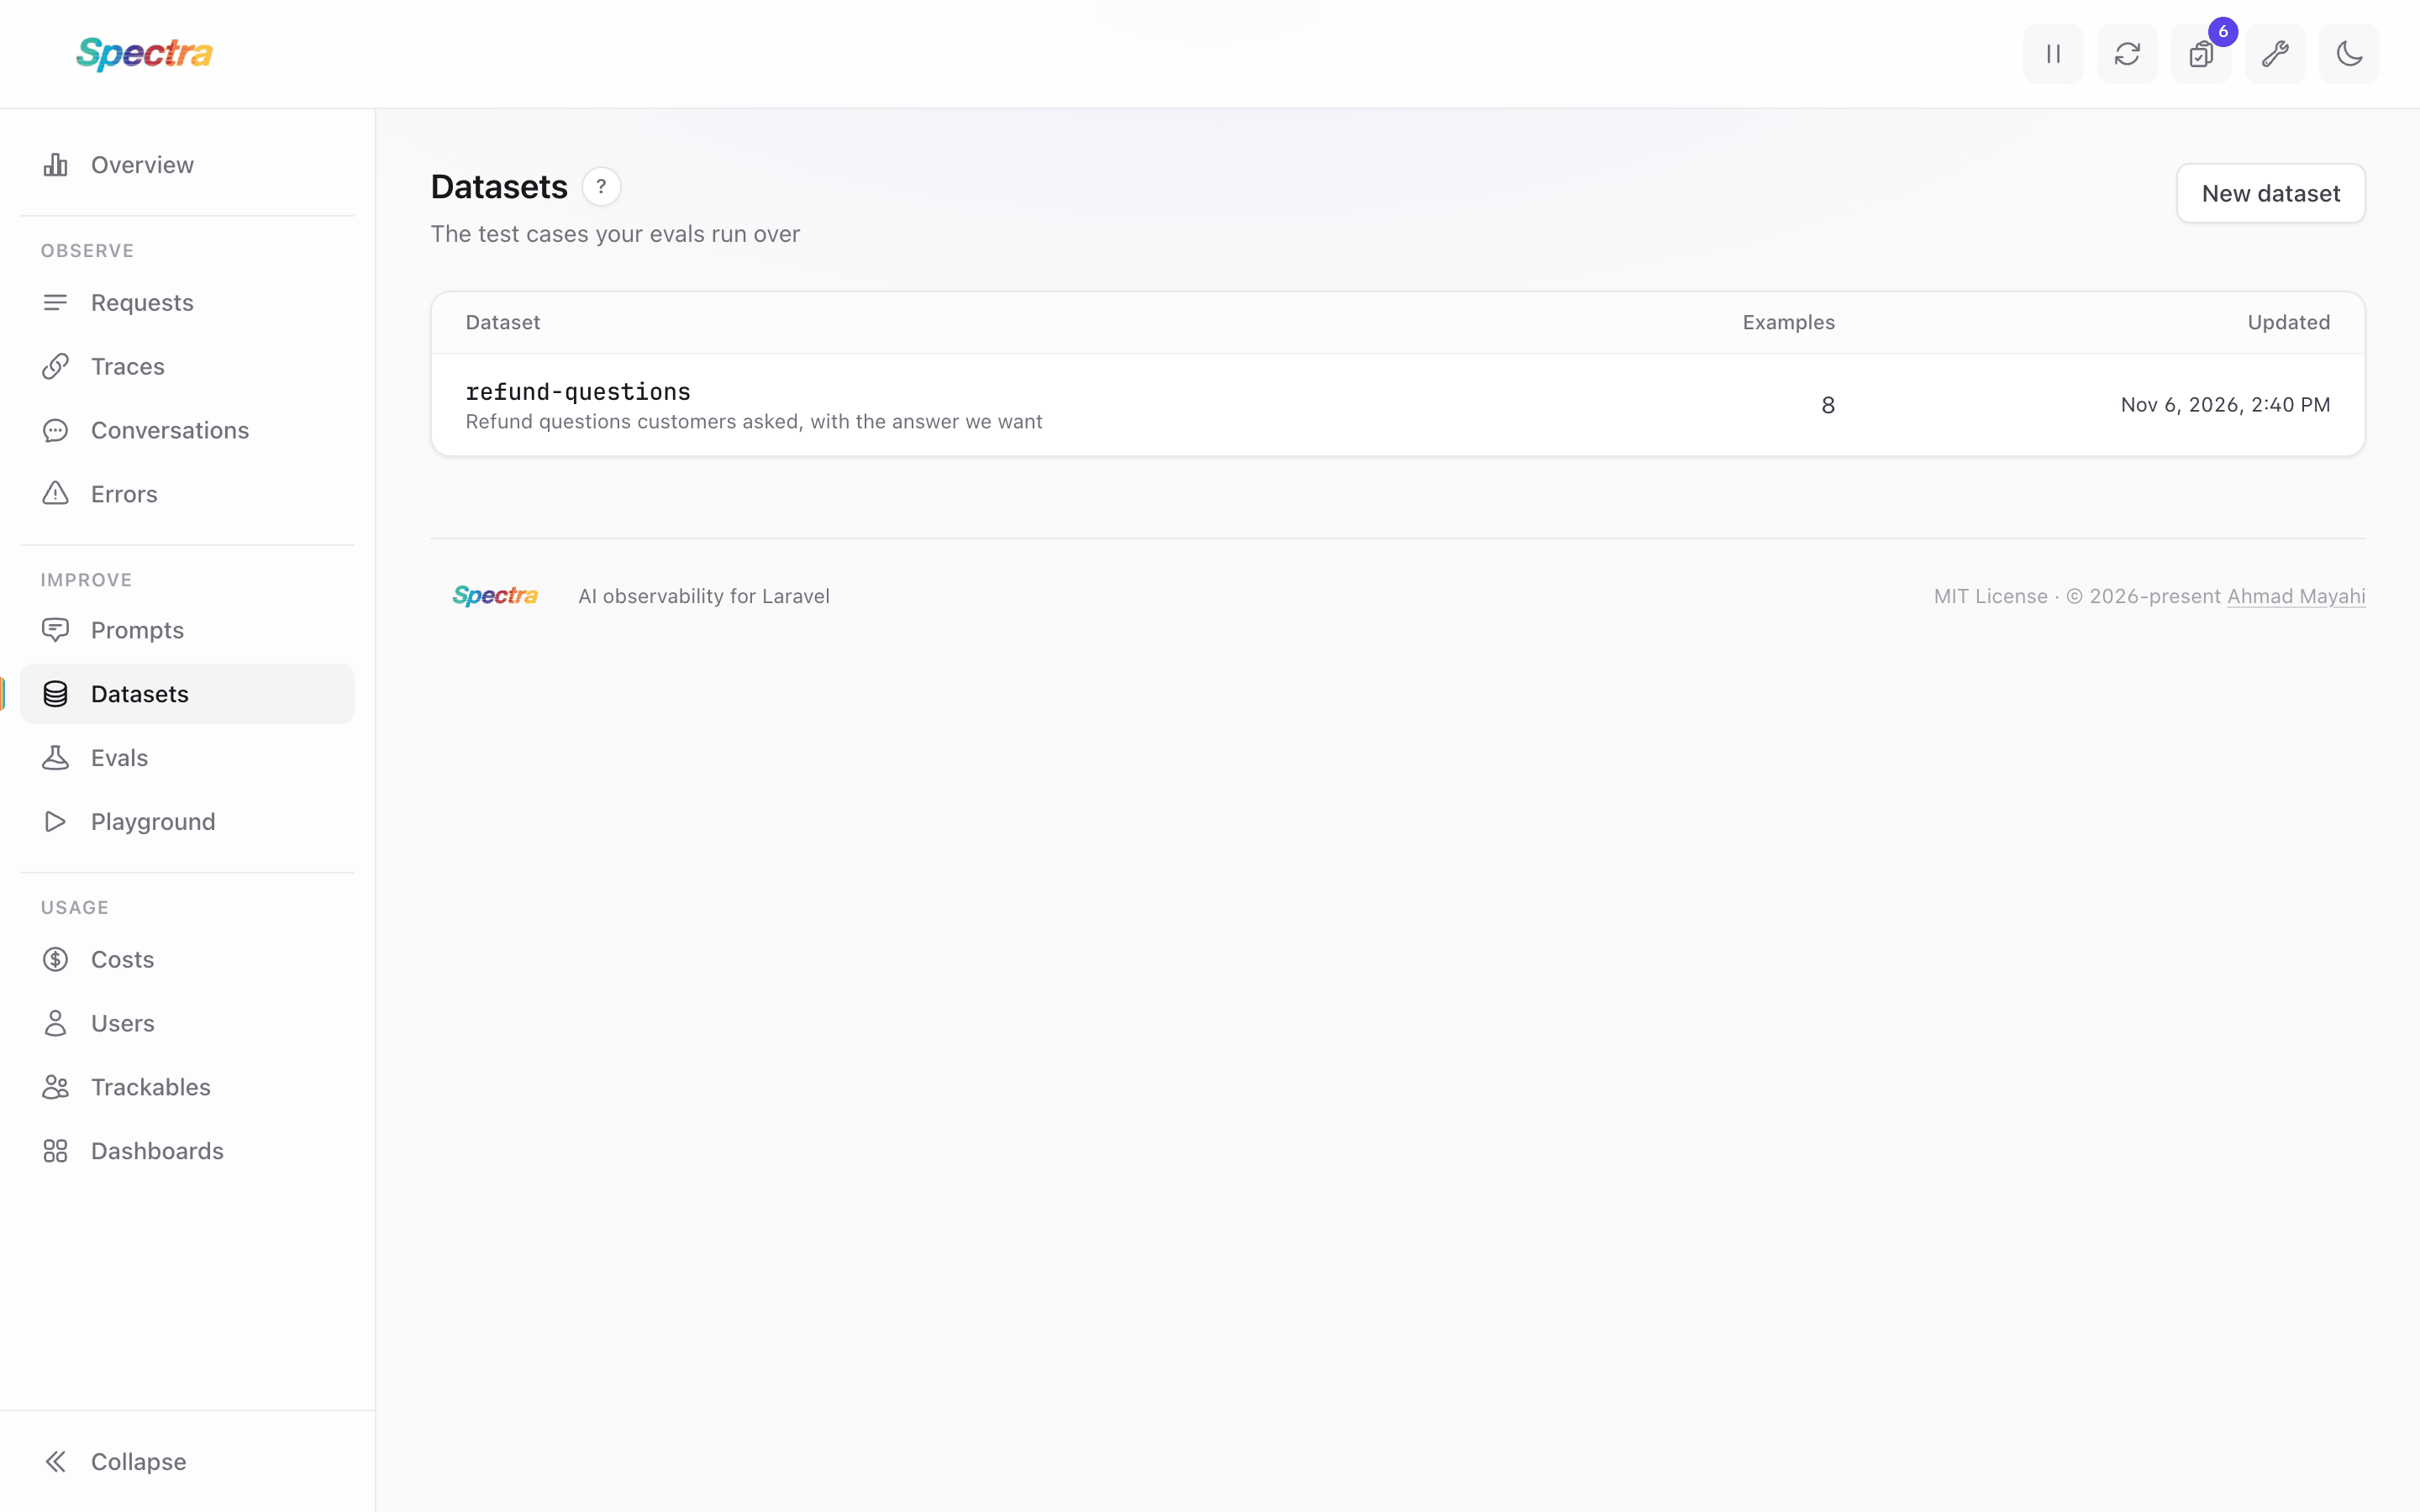
The Datasets screen lists every dataset with its number of examples, and New dataset creates one. Open one to see its examples and the runs over it:
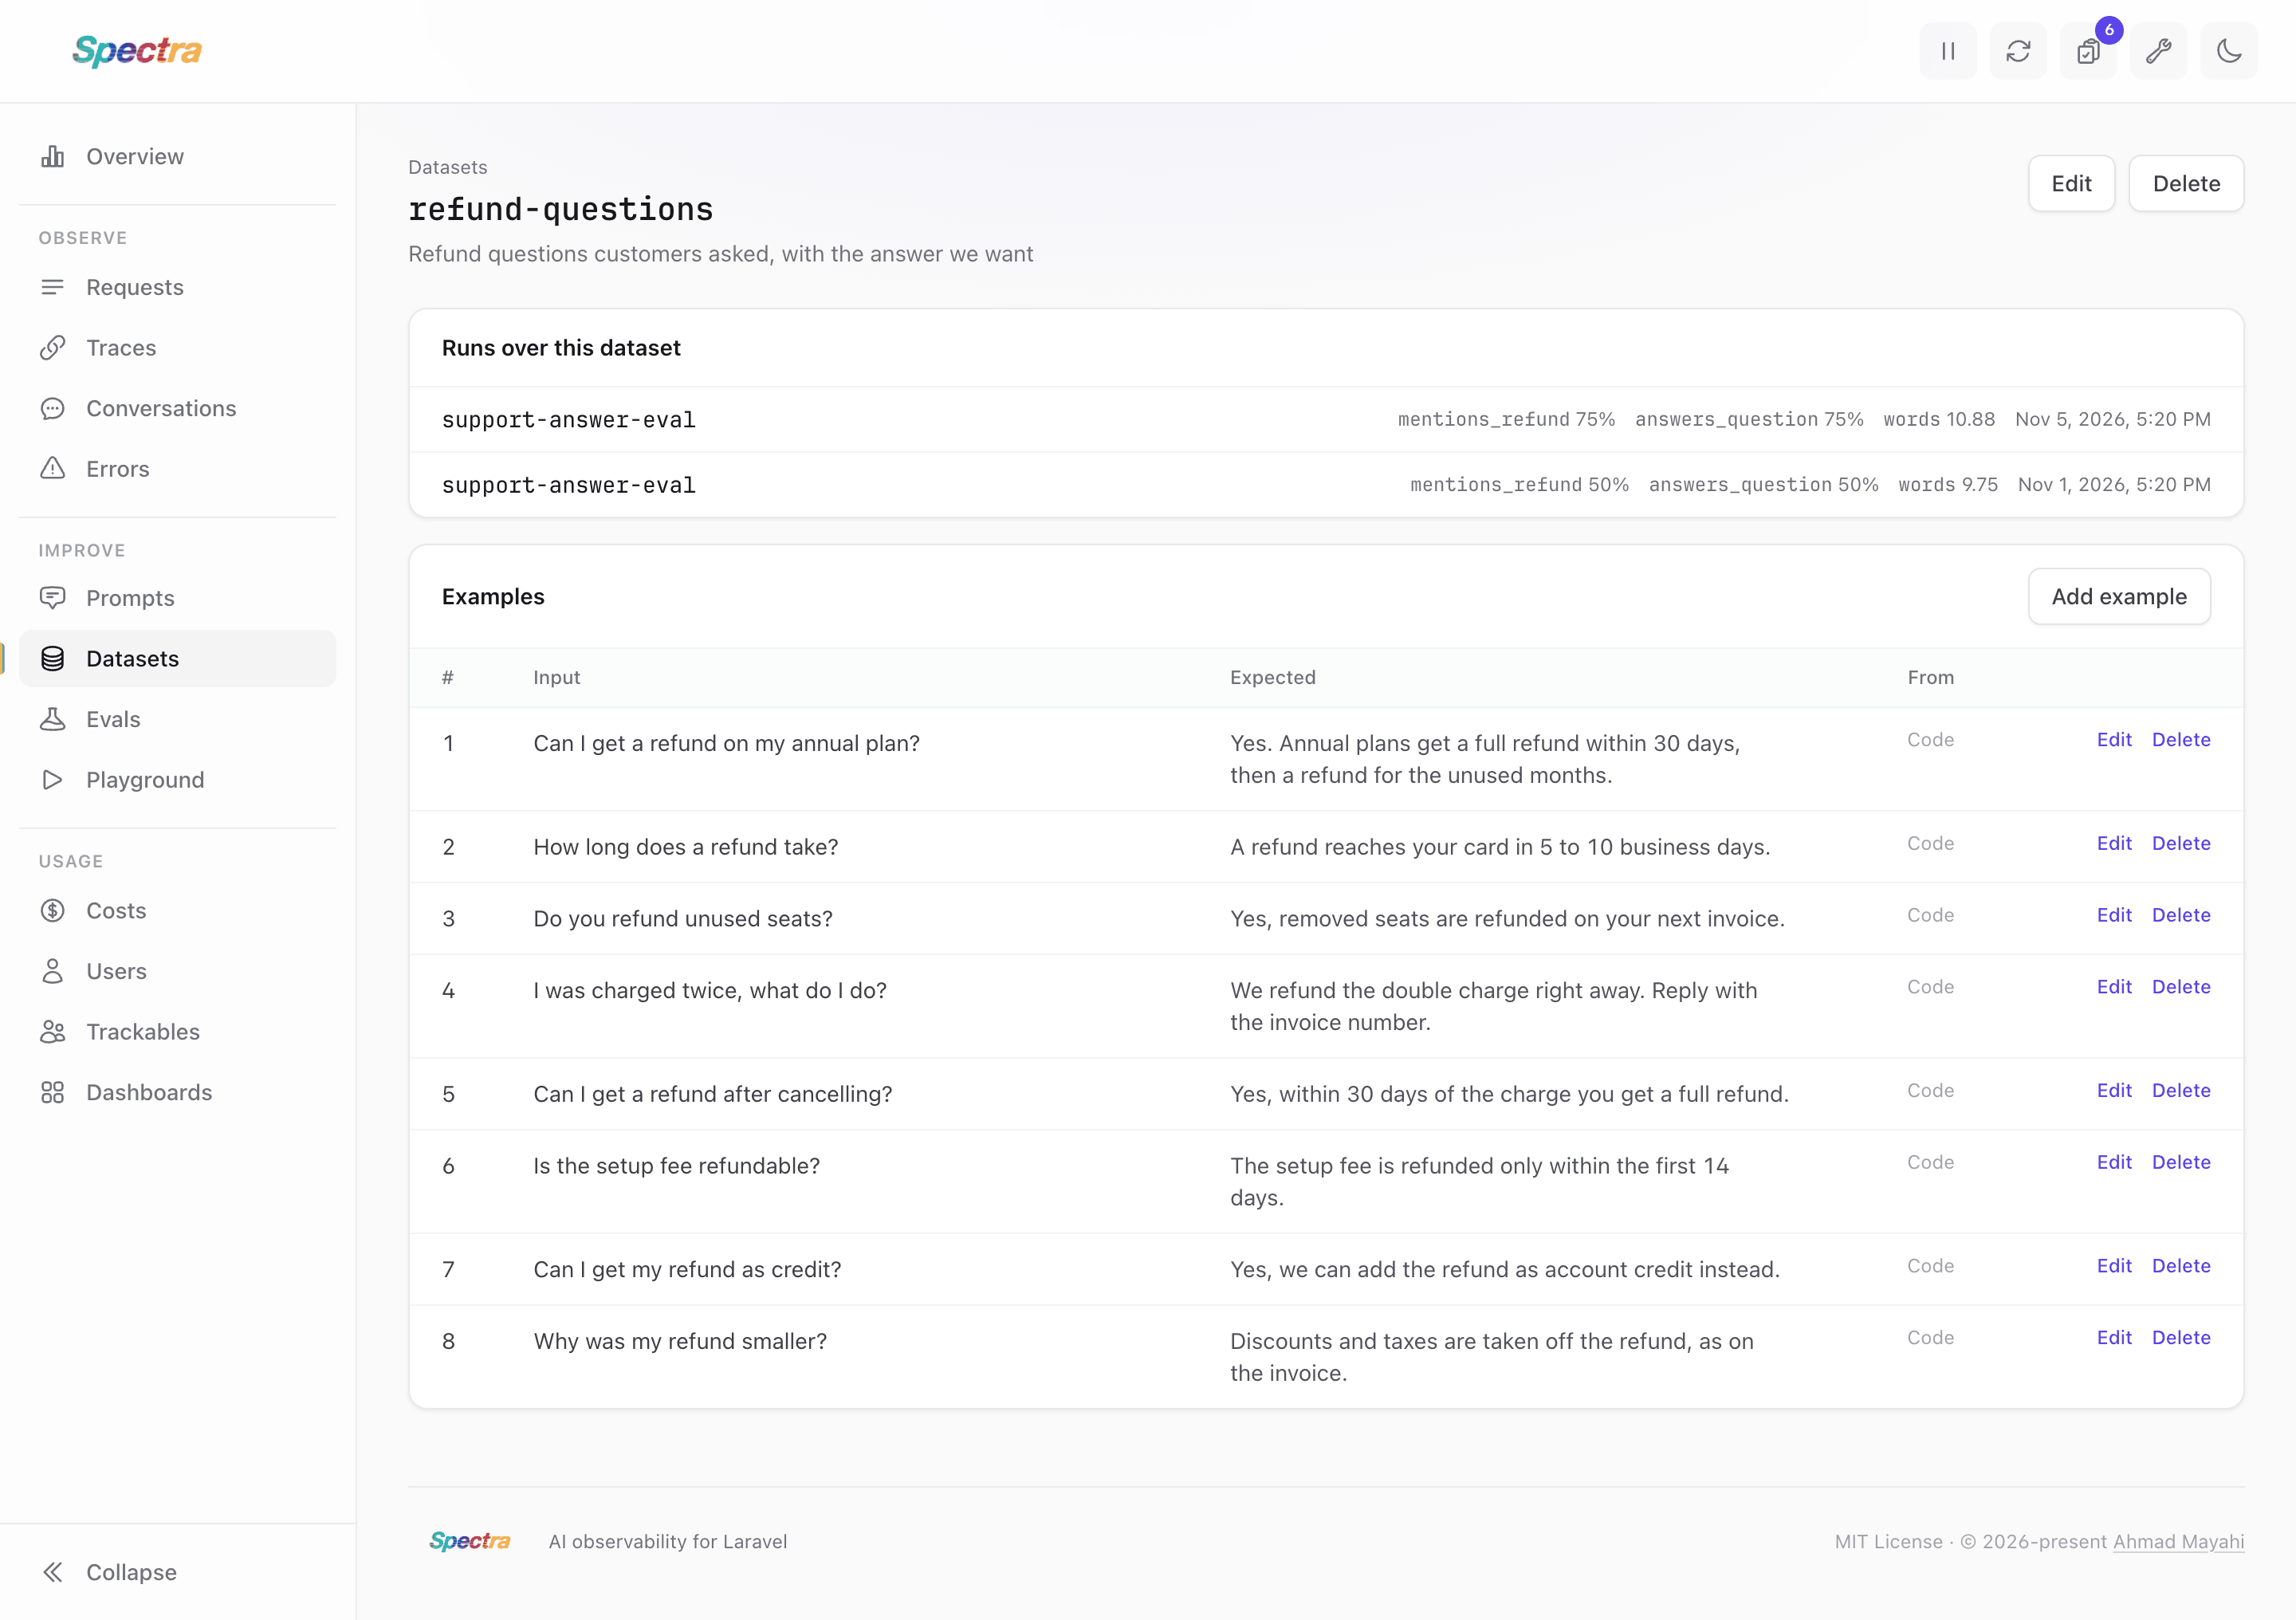
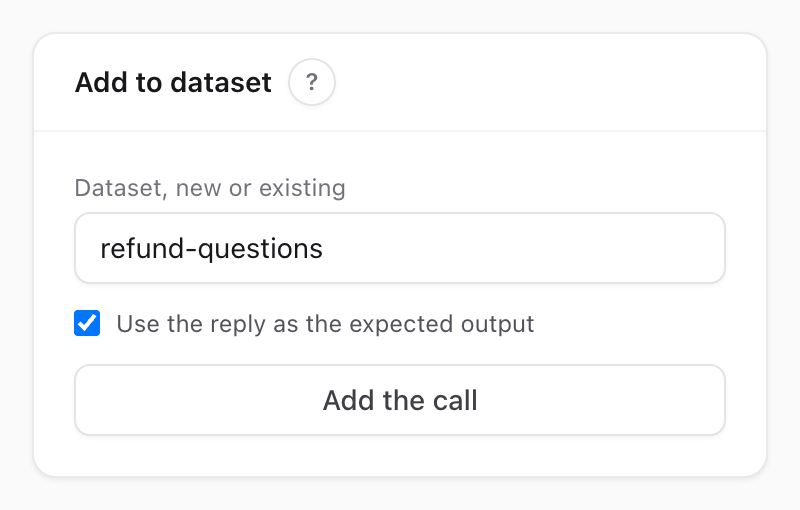
On a dataset's page, Add example lets you write an example by hand, as text or JSON, and each example has Edit and Delete to change or remove it. Edit and Delete at the top of the page rename the dataset, change its description or delete it. A call's page has an Add to dataset card that saves the call as an example:
Playground
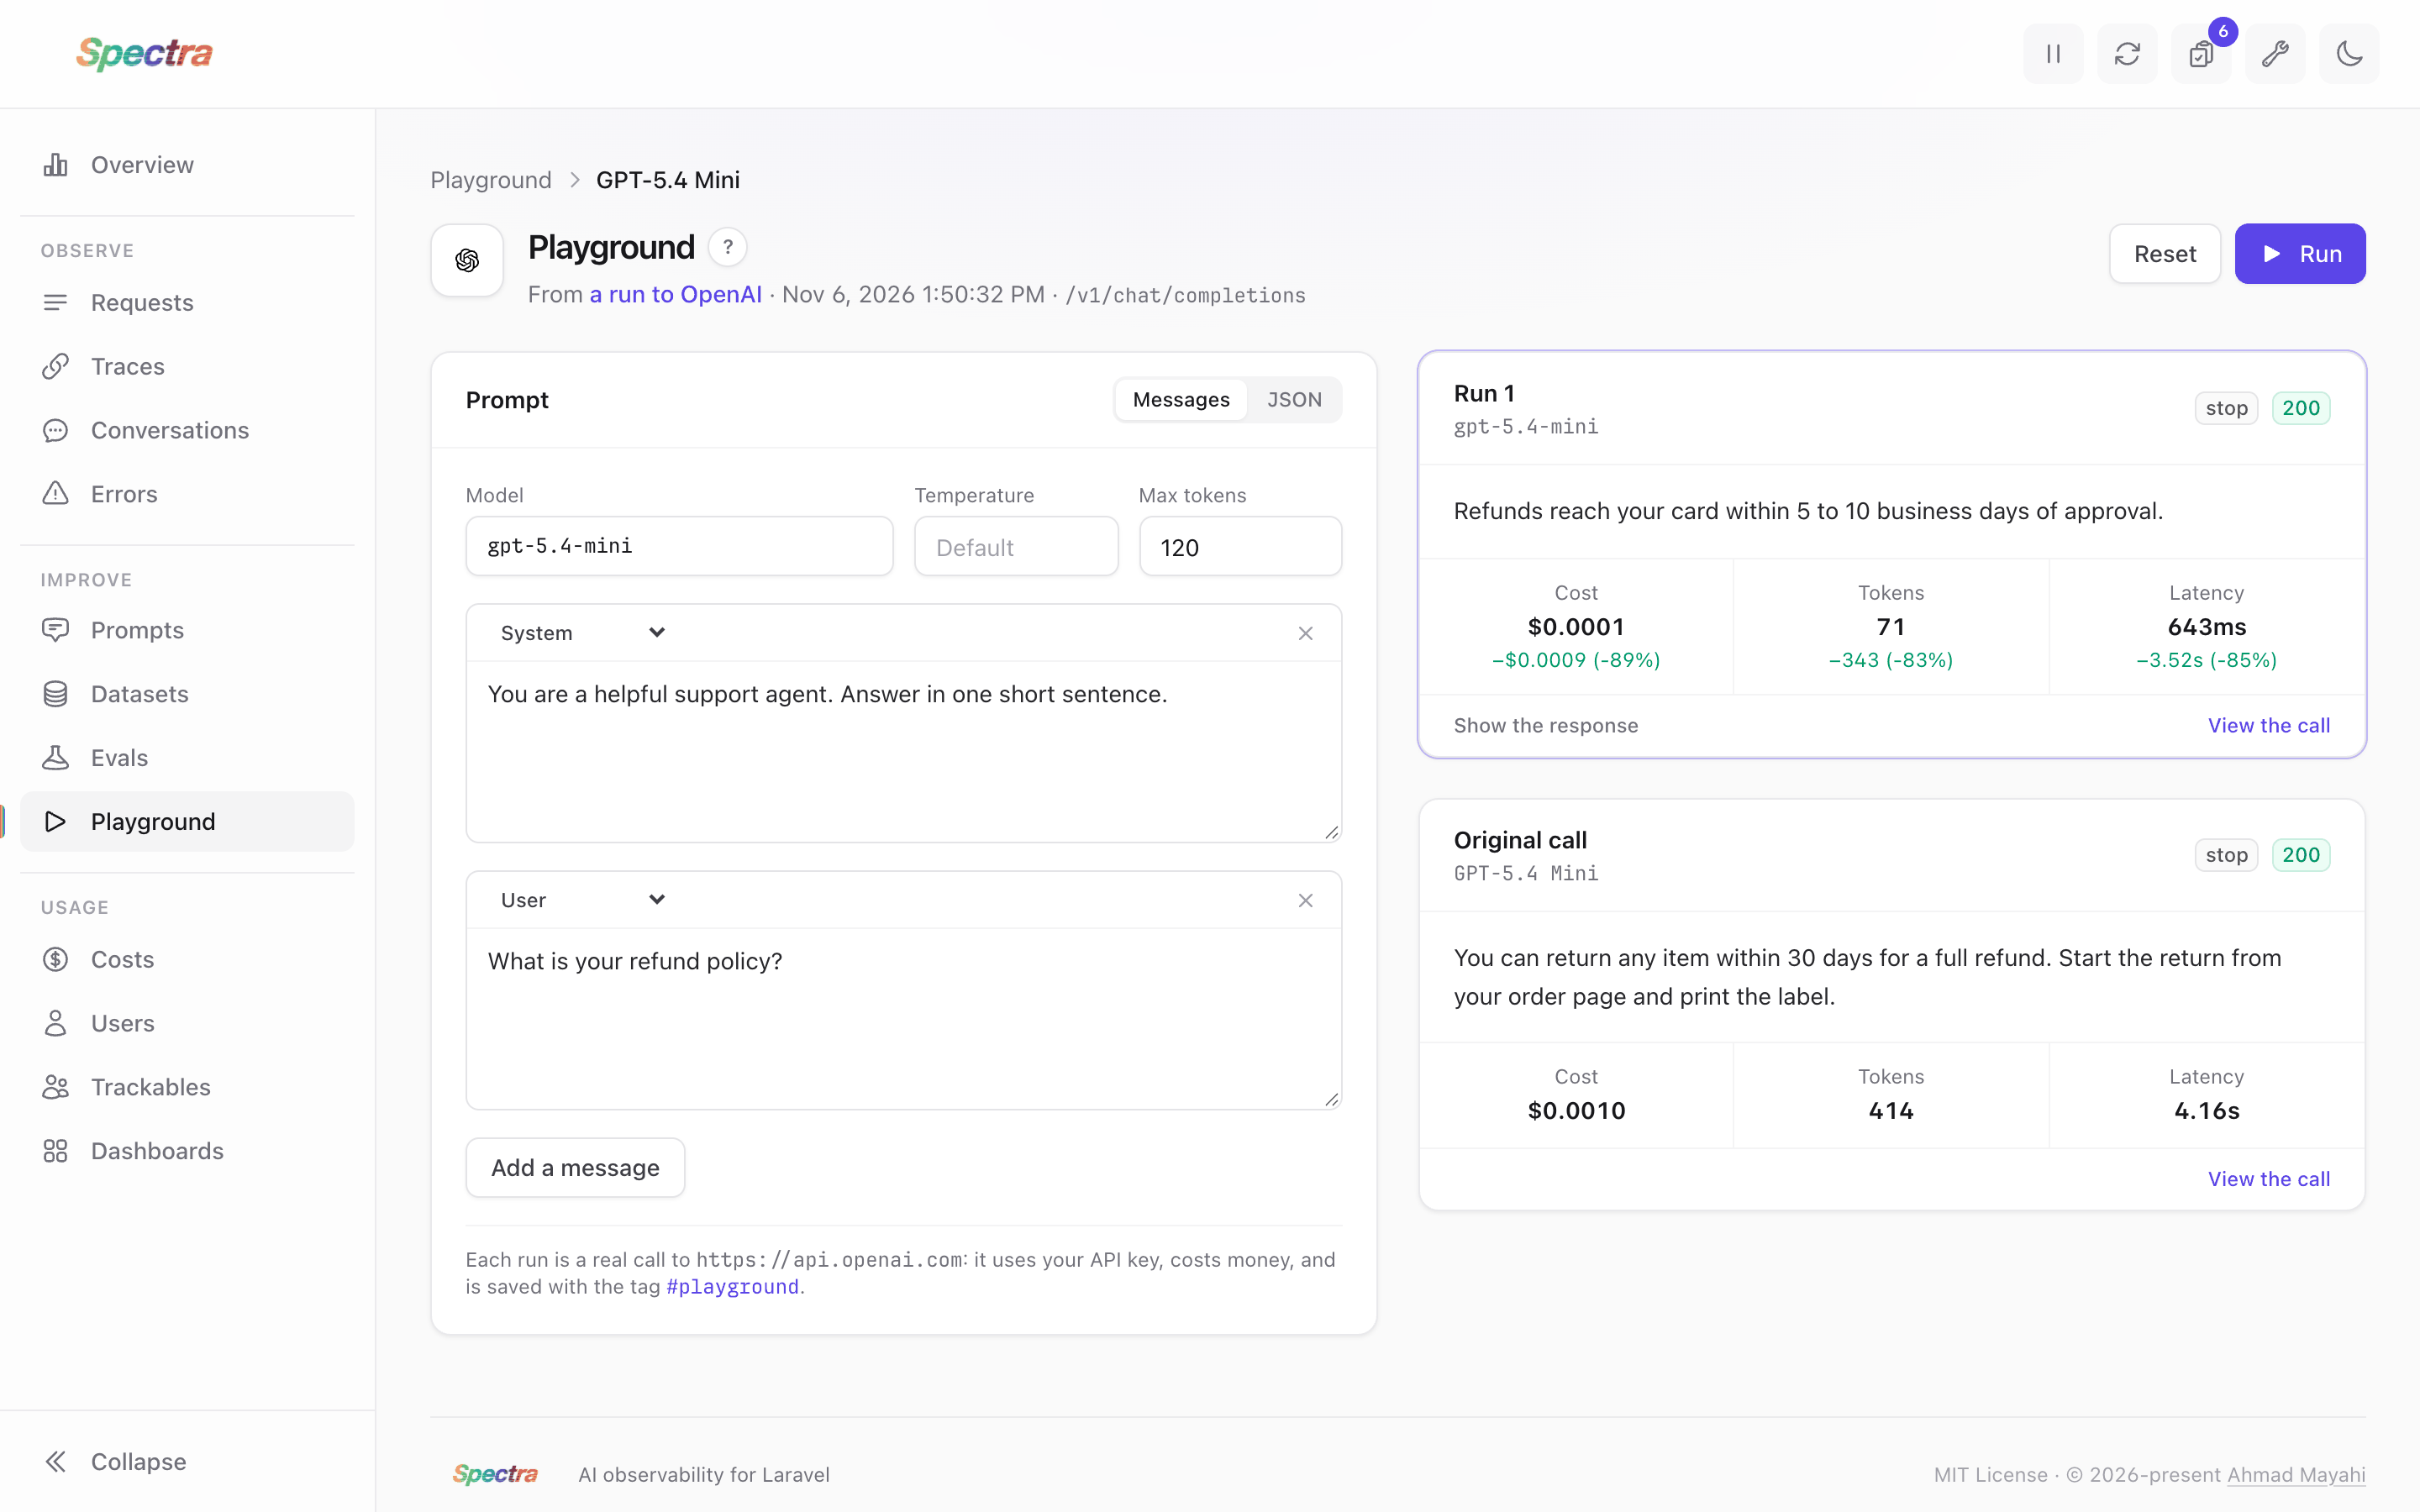
The Playground lets you write a new request, or open a real call to change its prompt, model or settings, send it again, and compare the new answer's reply, cost, tokens and latency with the original. Each run is a real call that costs money, so it's off until you set SPECTRA_PLAYGROUND_ENABLED=true, and using it needs the manageSpectra gate.
Press New request on the Playground screen, which lists what you've sent from it, or use Open in Playground on any request's page:

Dashboards
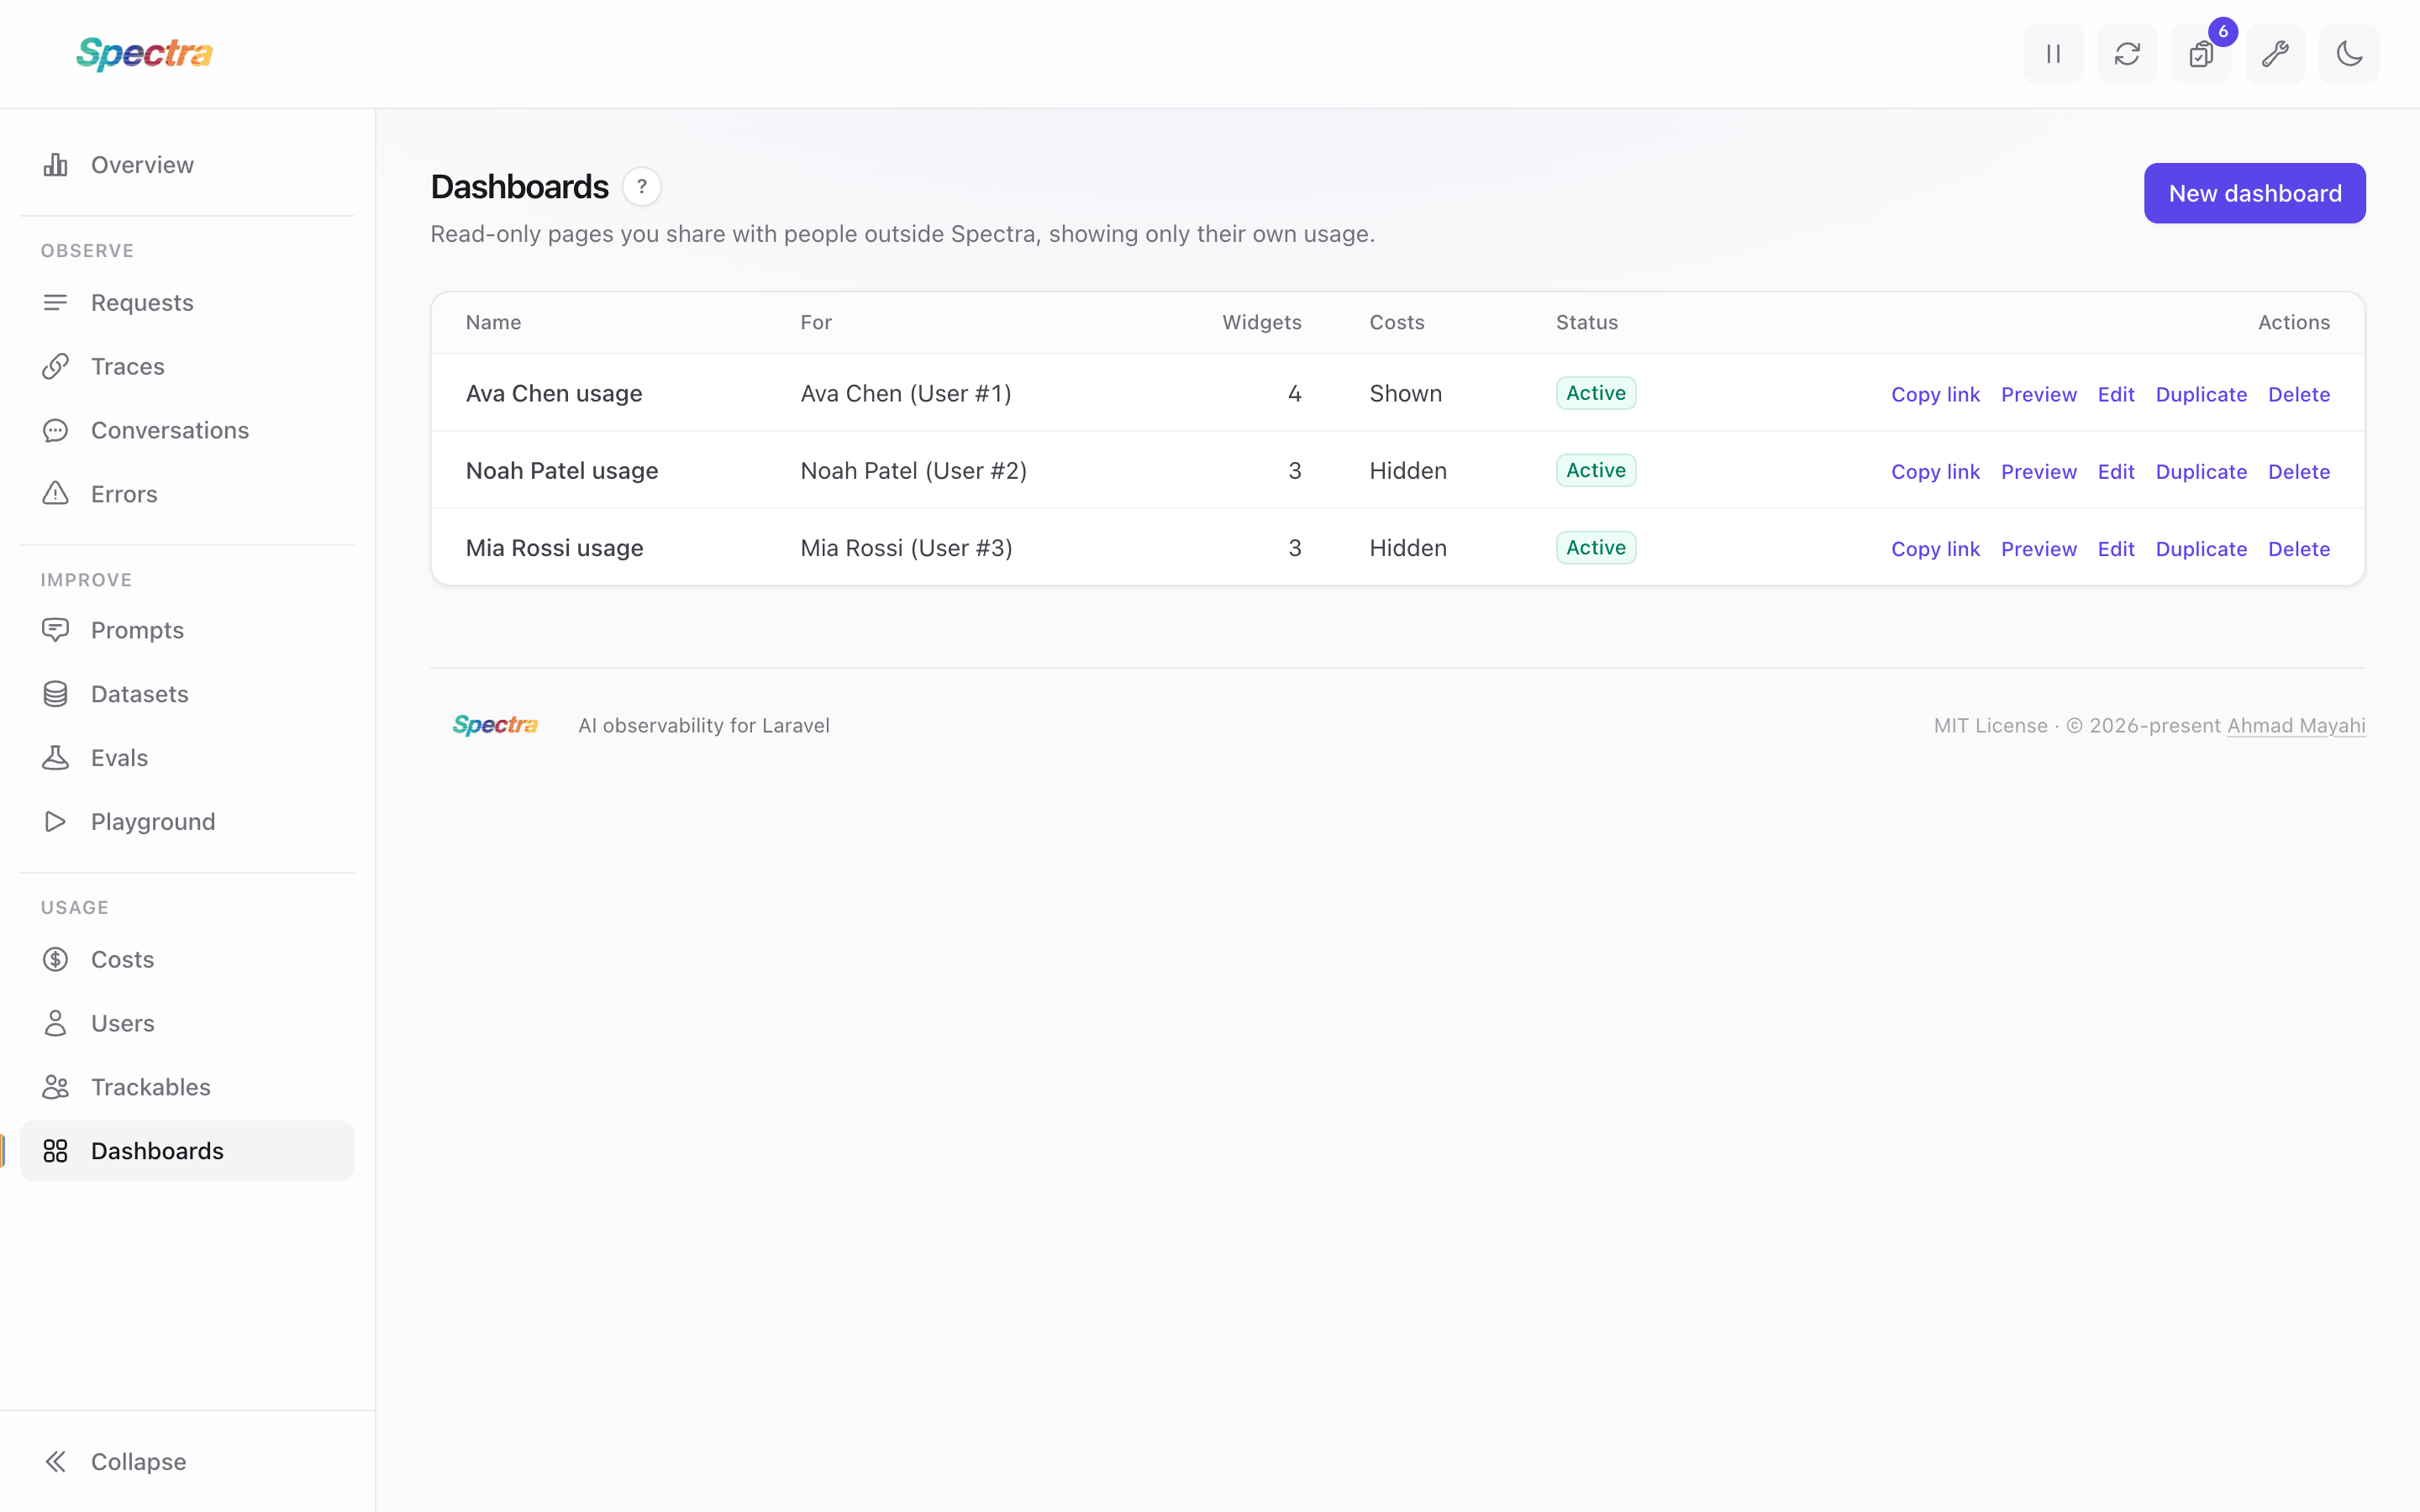
This screen is where you design shared dashboards: read-only pages you share with people who can't open Spectra's own dashboard, such as a customer who wants to see their own usage. You choose the widgets and who can see it, and get a link to give them. They're off until you set SPECTRA_DASHBOARDS_ENABLED=true, and designing one needs the manageSpectra gate.
Costs
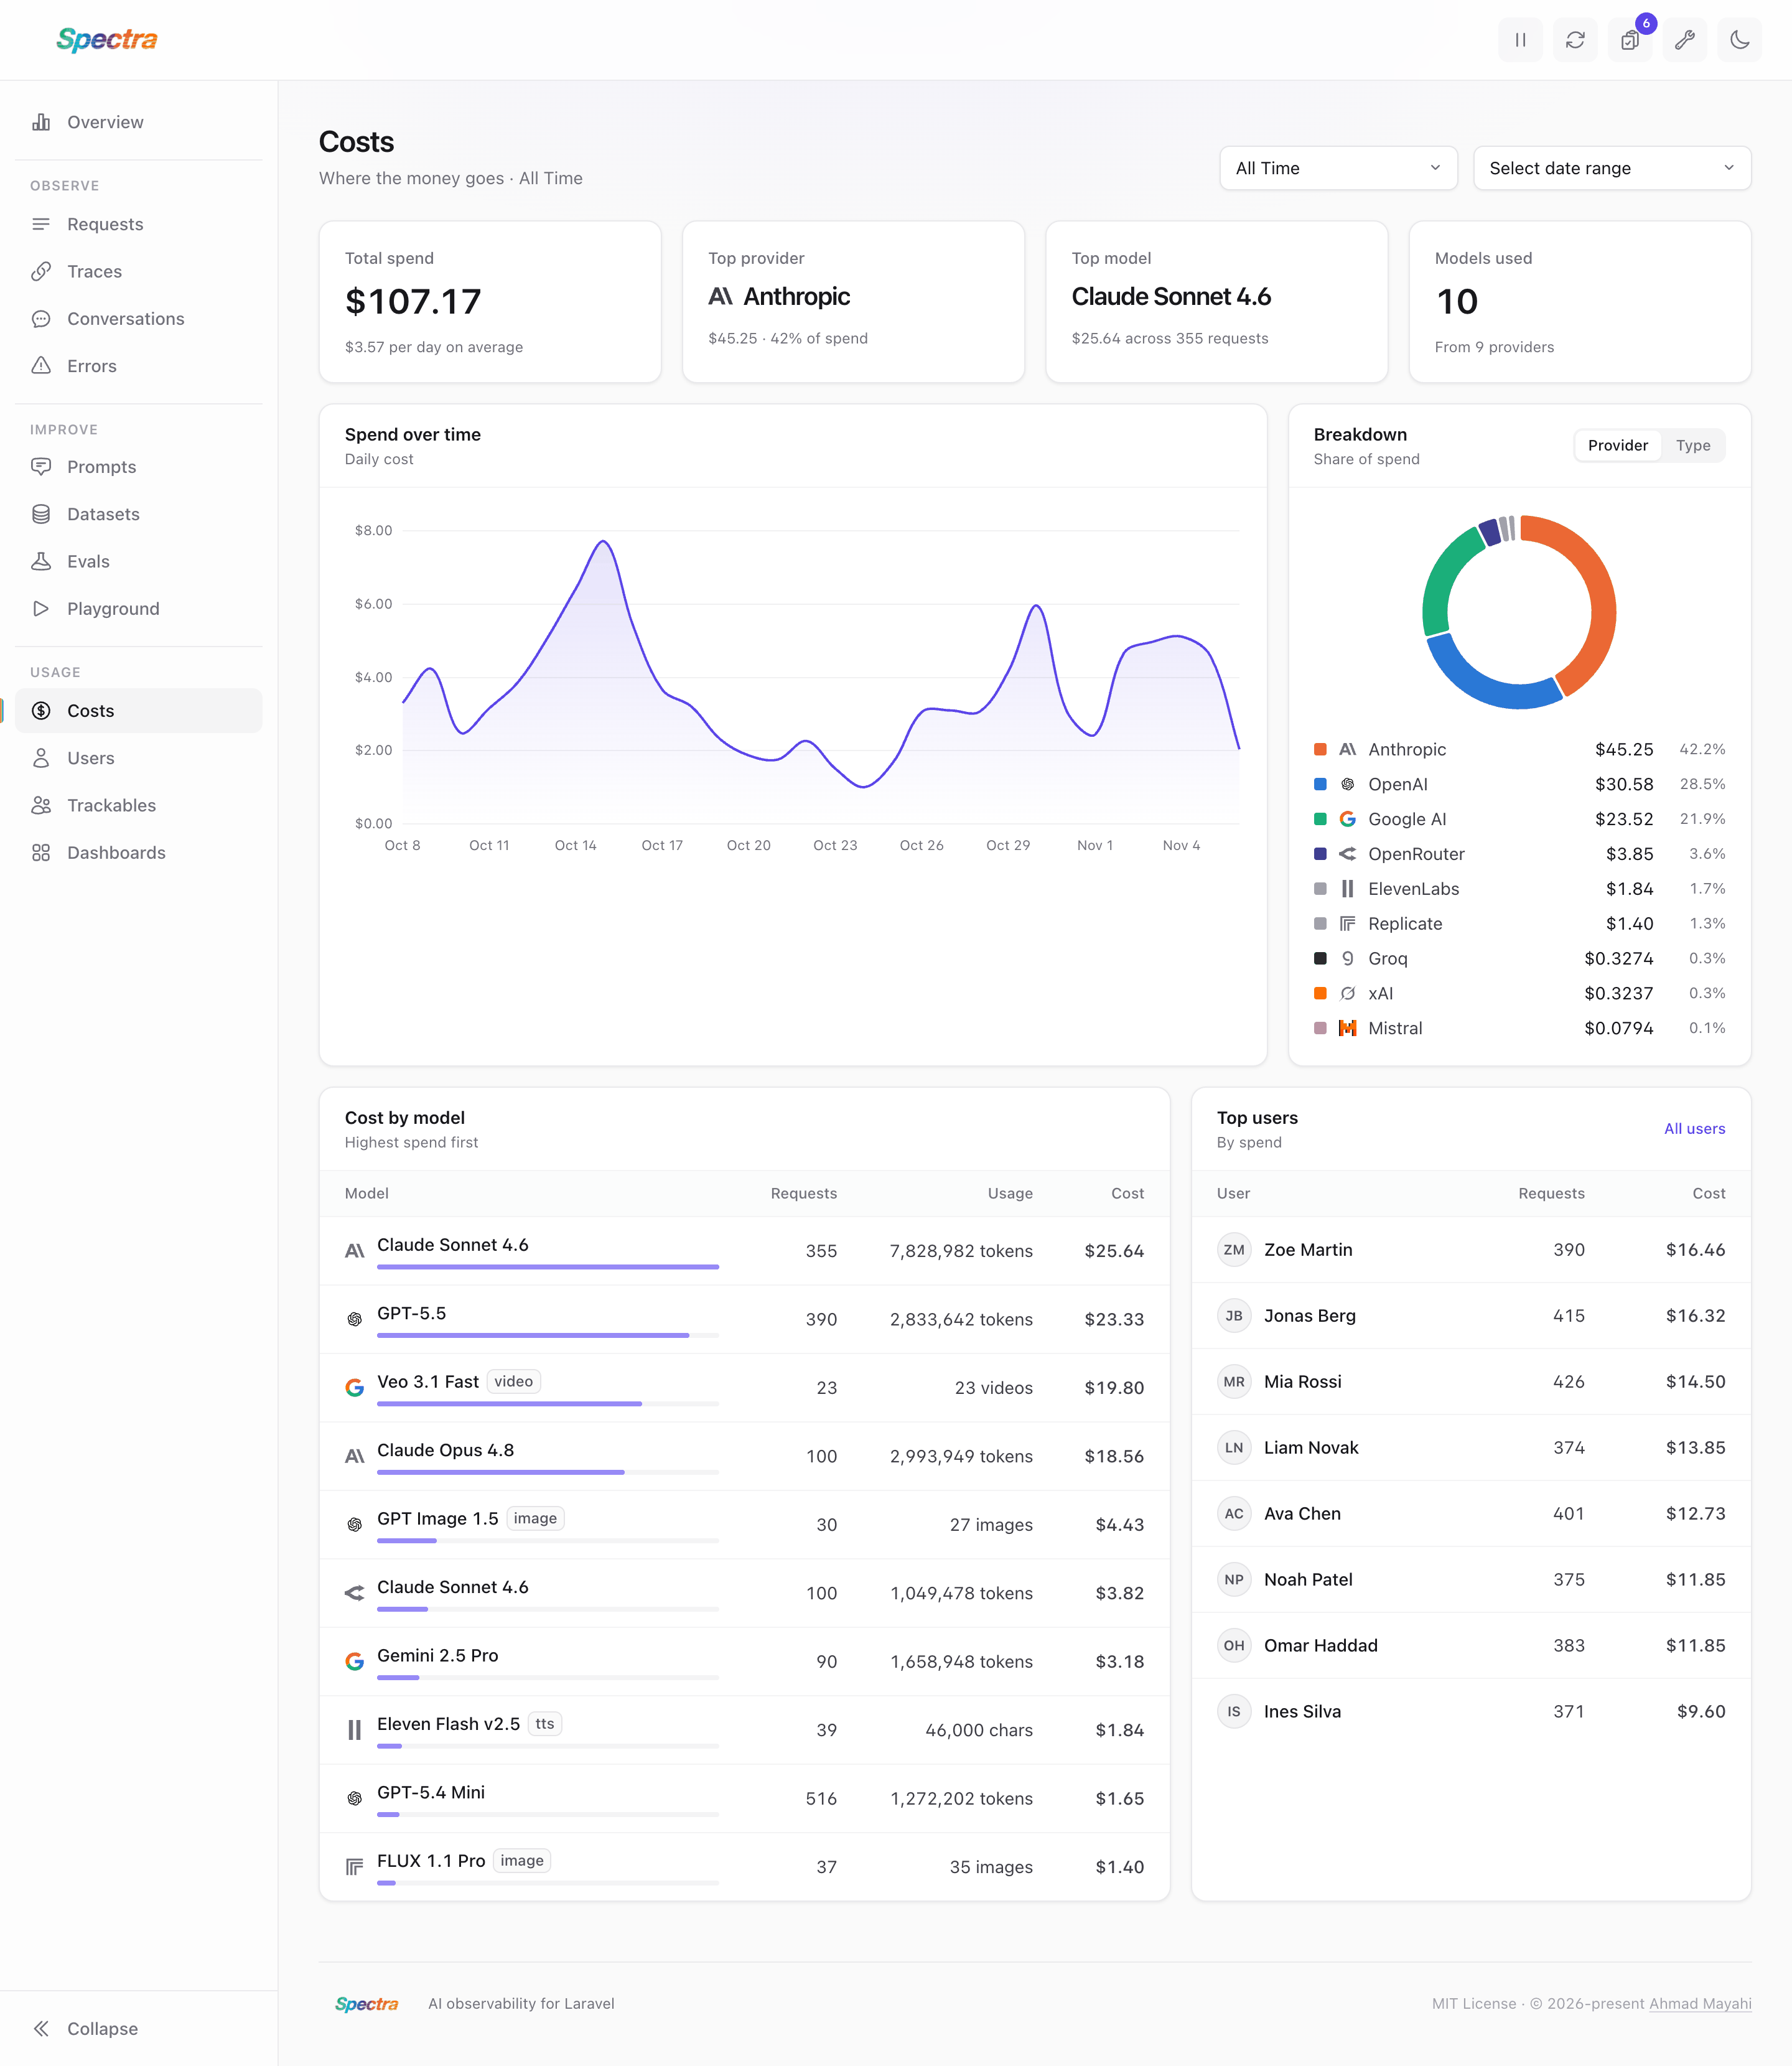
The costs screen shows where the money goes:
- Total spend, the top provider and top model, and how many models you used.
- Spend over time, one point per day.
- Breakdown of spend by provider or by model type.
- Cost by model, with the usage in the model's own unit: tokens, images, videos or characters.
- Top users by spend. Only trackables whose model is authenticatable count as users; teams, conversations and other trackables are in the trackables list. All users opens the Users screen.
To see what one model costs, pick it in the model filter next to the period. It lists every model called in the period, grouped by provider, and narrows every number and card on the screen to that model. The same model id served by two providers (an OpenAI model called directly and through OpenRouter, say) is two choices. The filter stays in the URL, so a filtered view can be bookmarked or shared.
See Costs for how each cost is calculated.
Trackables
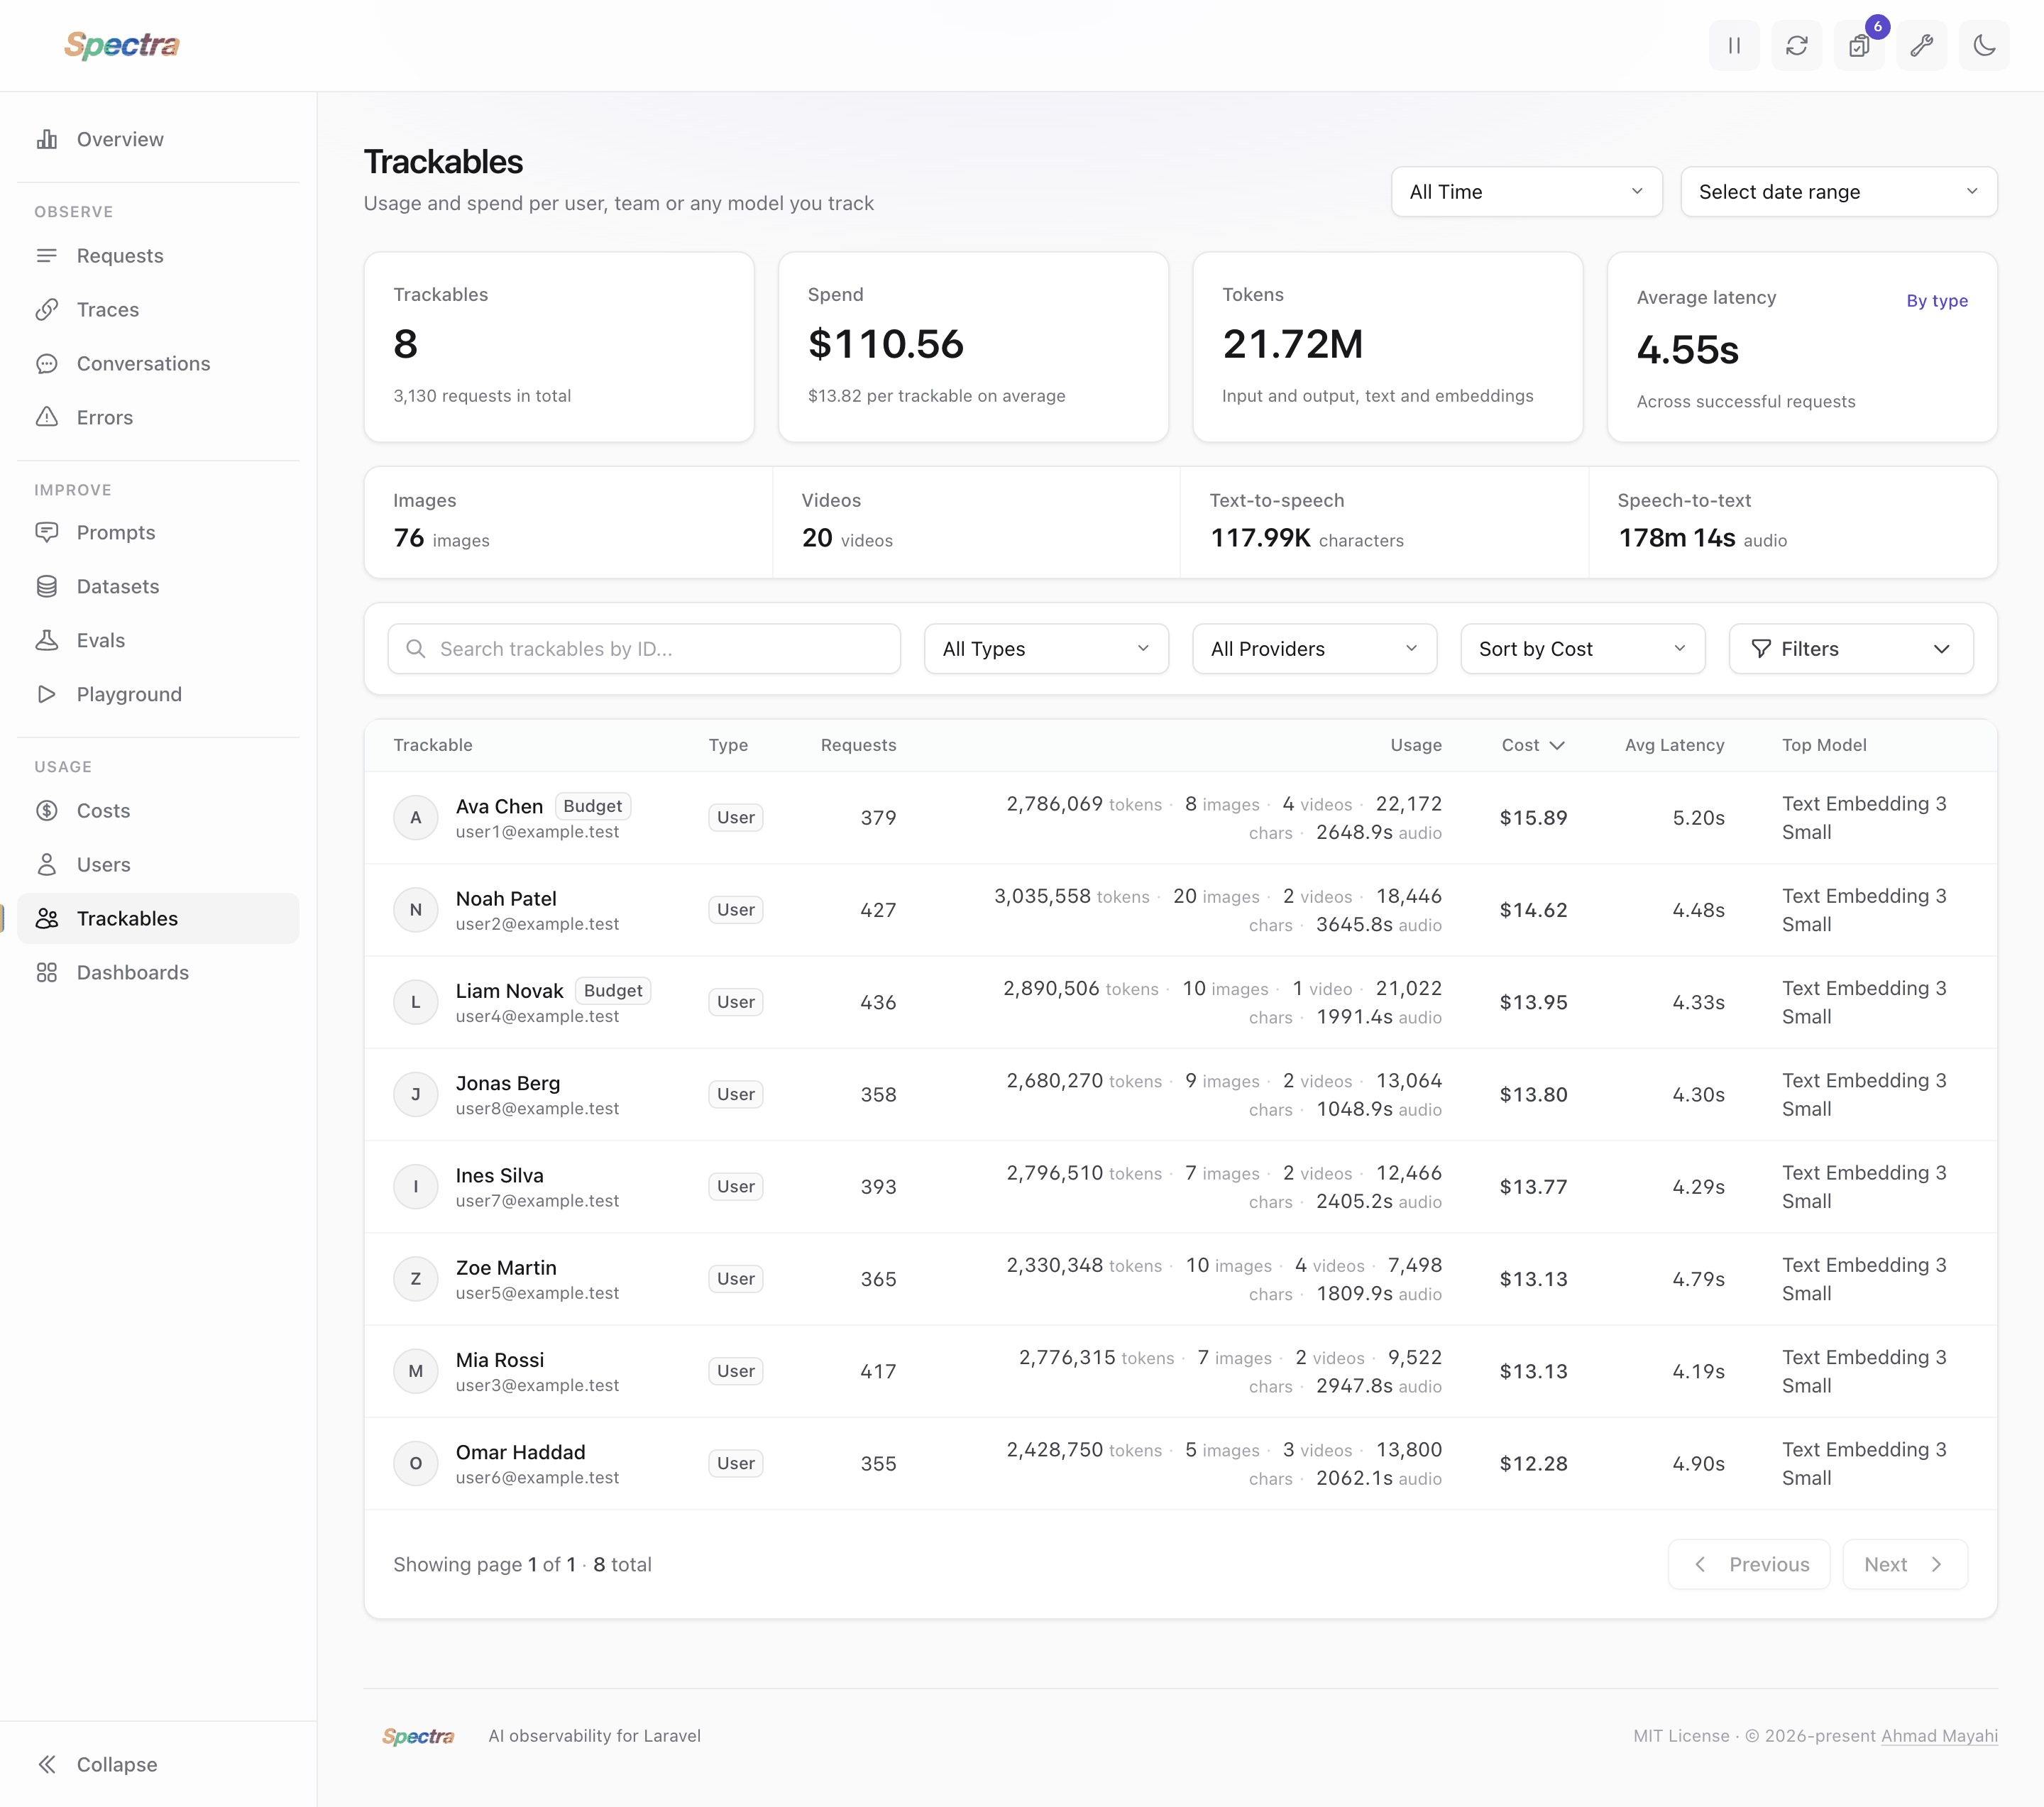
A trackable is the model a request is attributed to: the signed-in user by default, or a team, project or any other Eloquent model you choose (see User Attribution). The trackables list shows each one's requests, tokens, media, cost, average latency and most used model. Filter by trackable type (the User, Team, ... the requests were attributed to), provider, tag and more, and sort by cost, requests or usage.
The Users screen is the same list with only the users: the trackables whose model is authenticatable.
Trackable Details
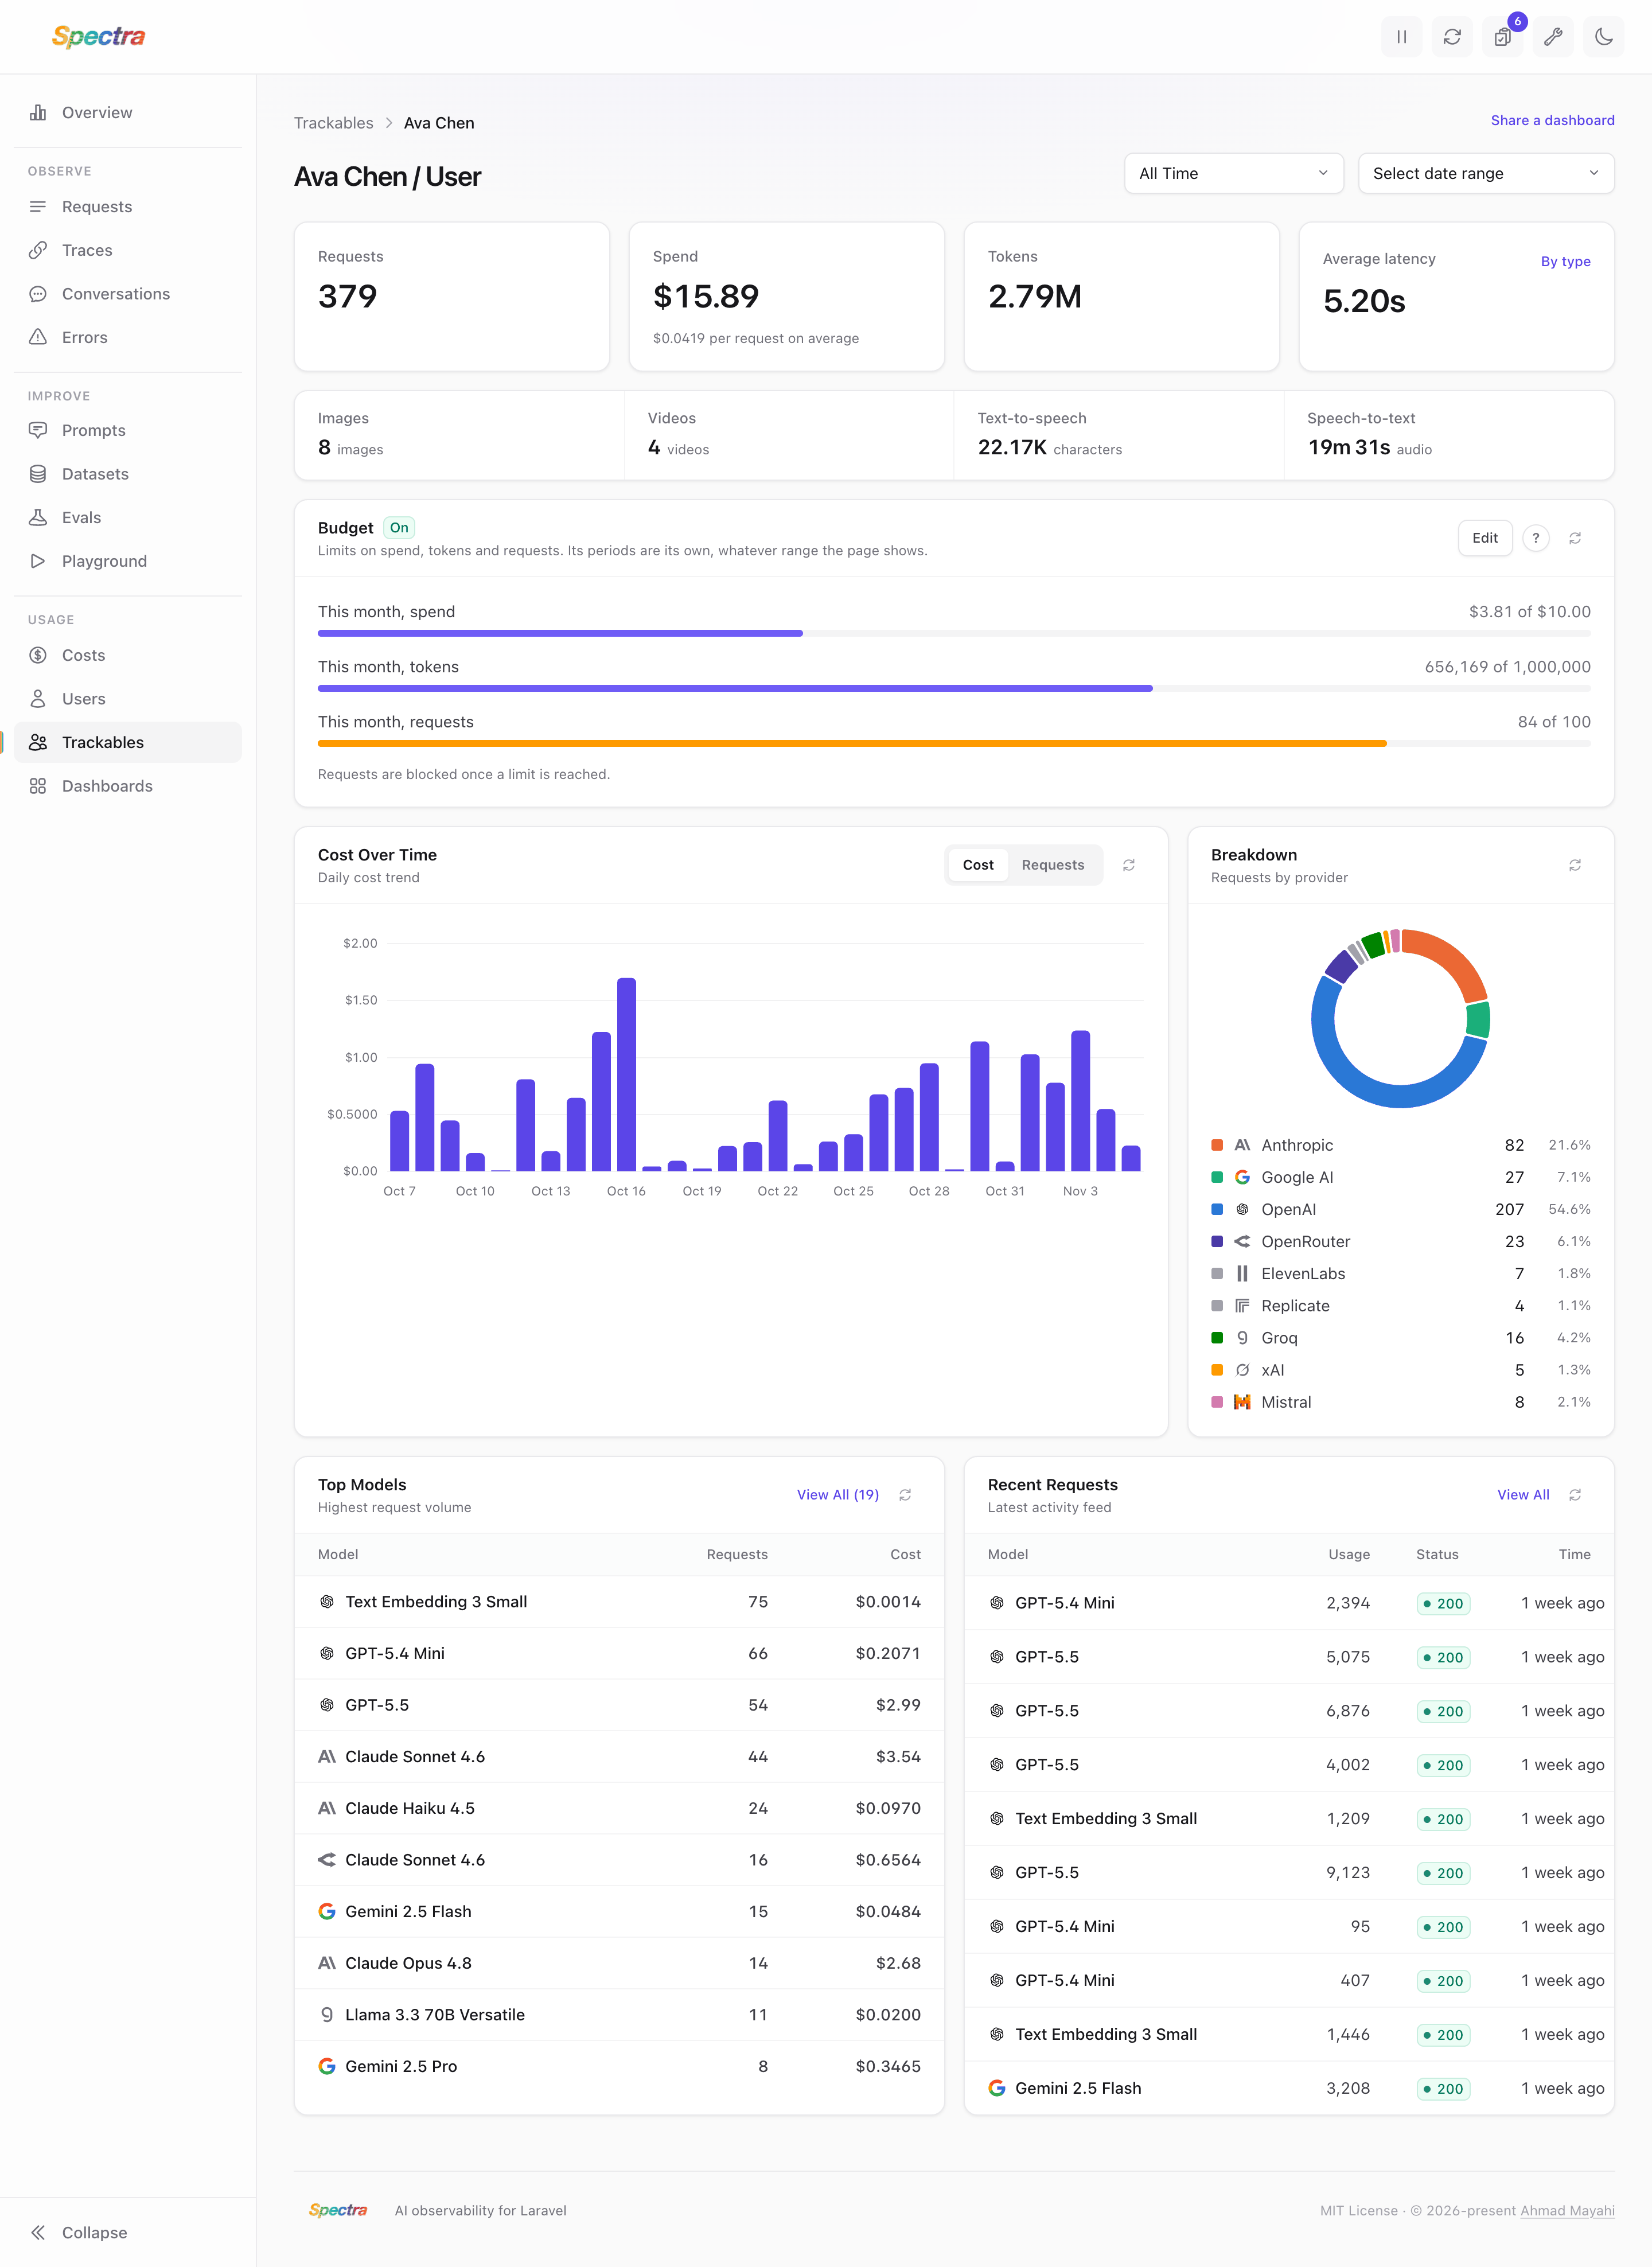
Open a trackable to see its spend and requests over time, the providers and models it uses, and its latest requests. This is the page to check when one user's spend looks off.
The Budget card shows the trackable's budget: each limit on spend, tokens or requests, with what is used against it. Users the manageSpectra gate allows can set, change, switch off and remove the budget there. See Setting Budgets from the Dashboard.
Maintenance
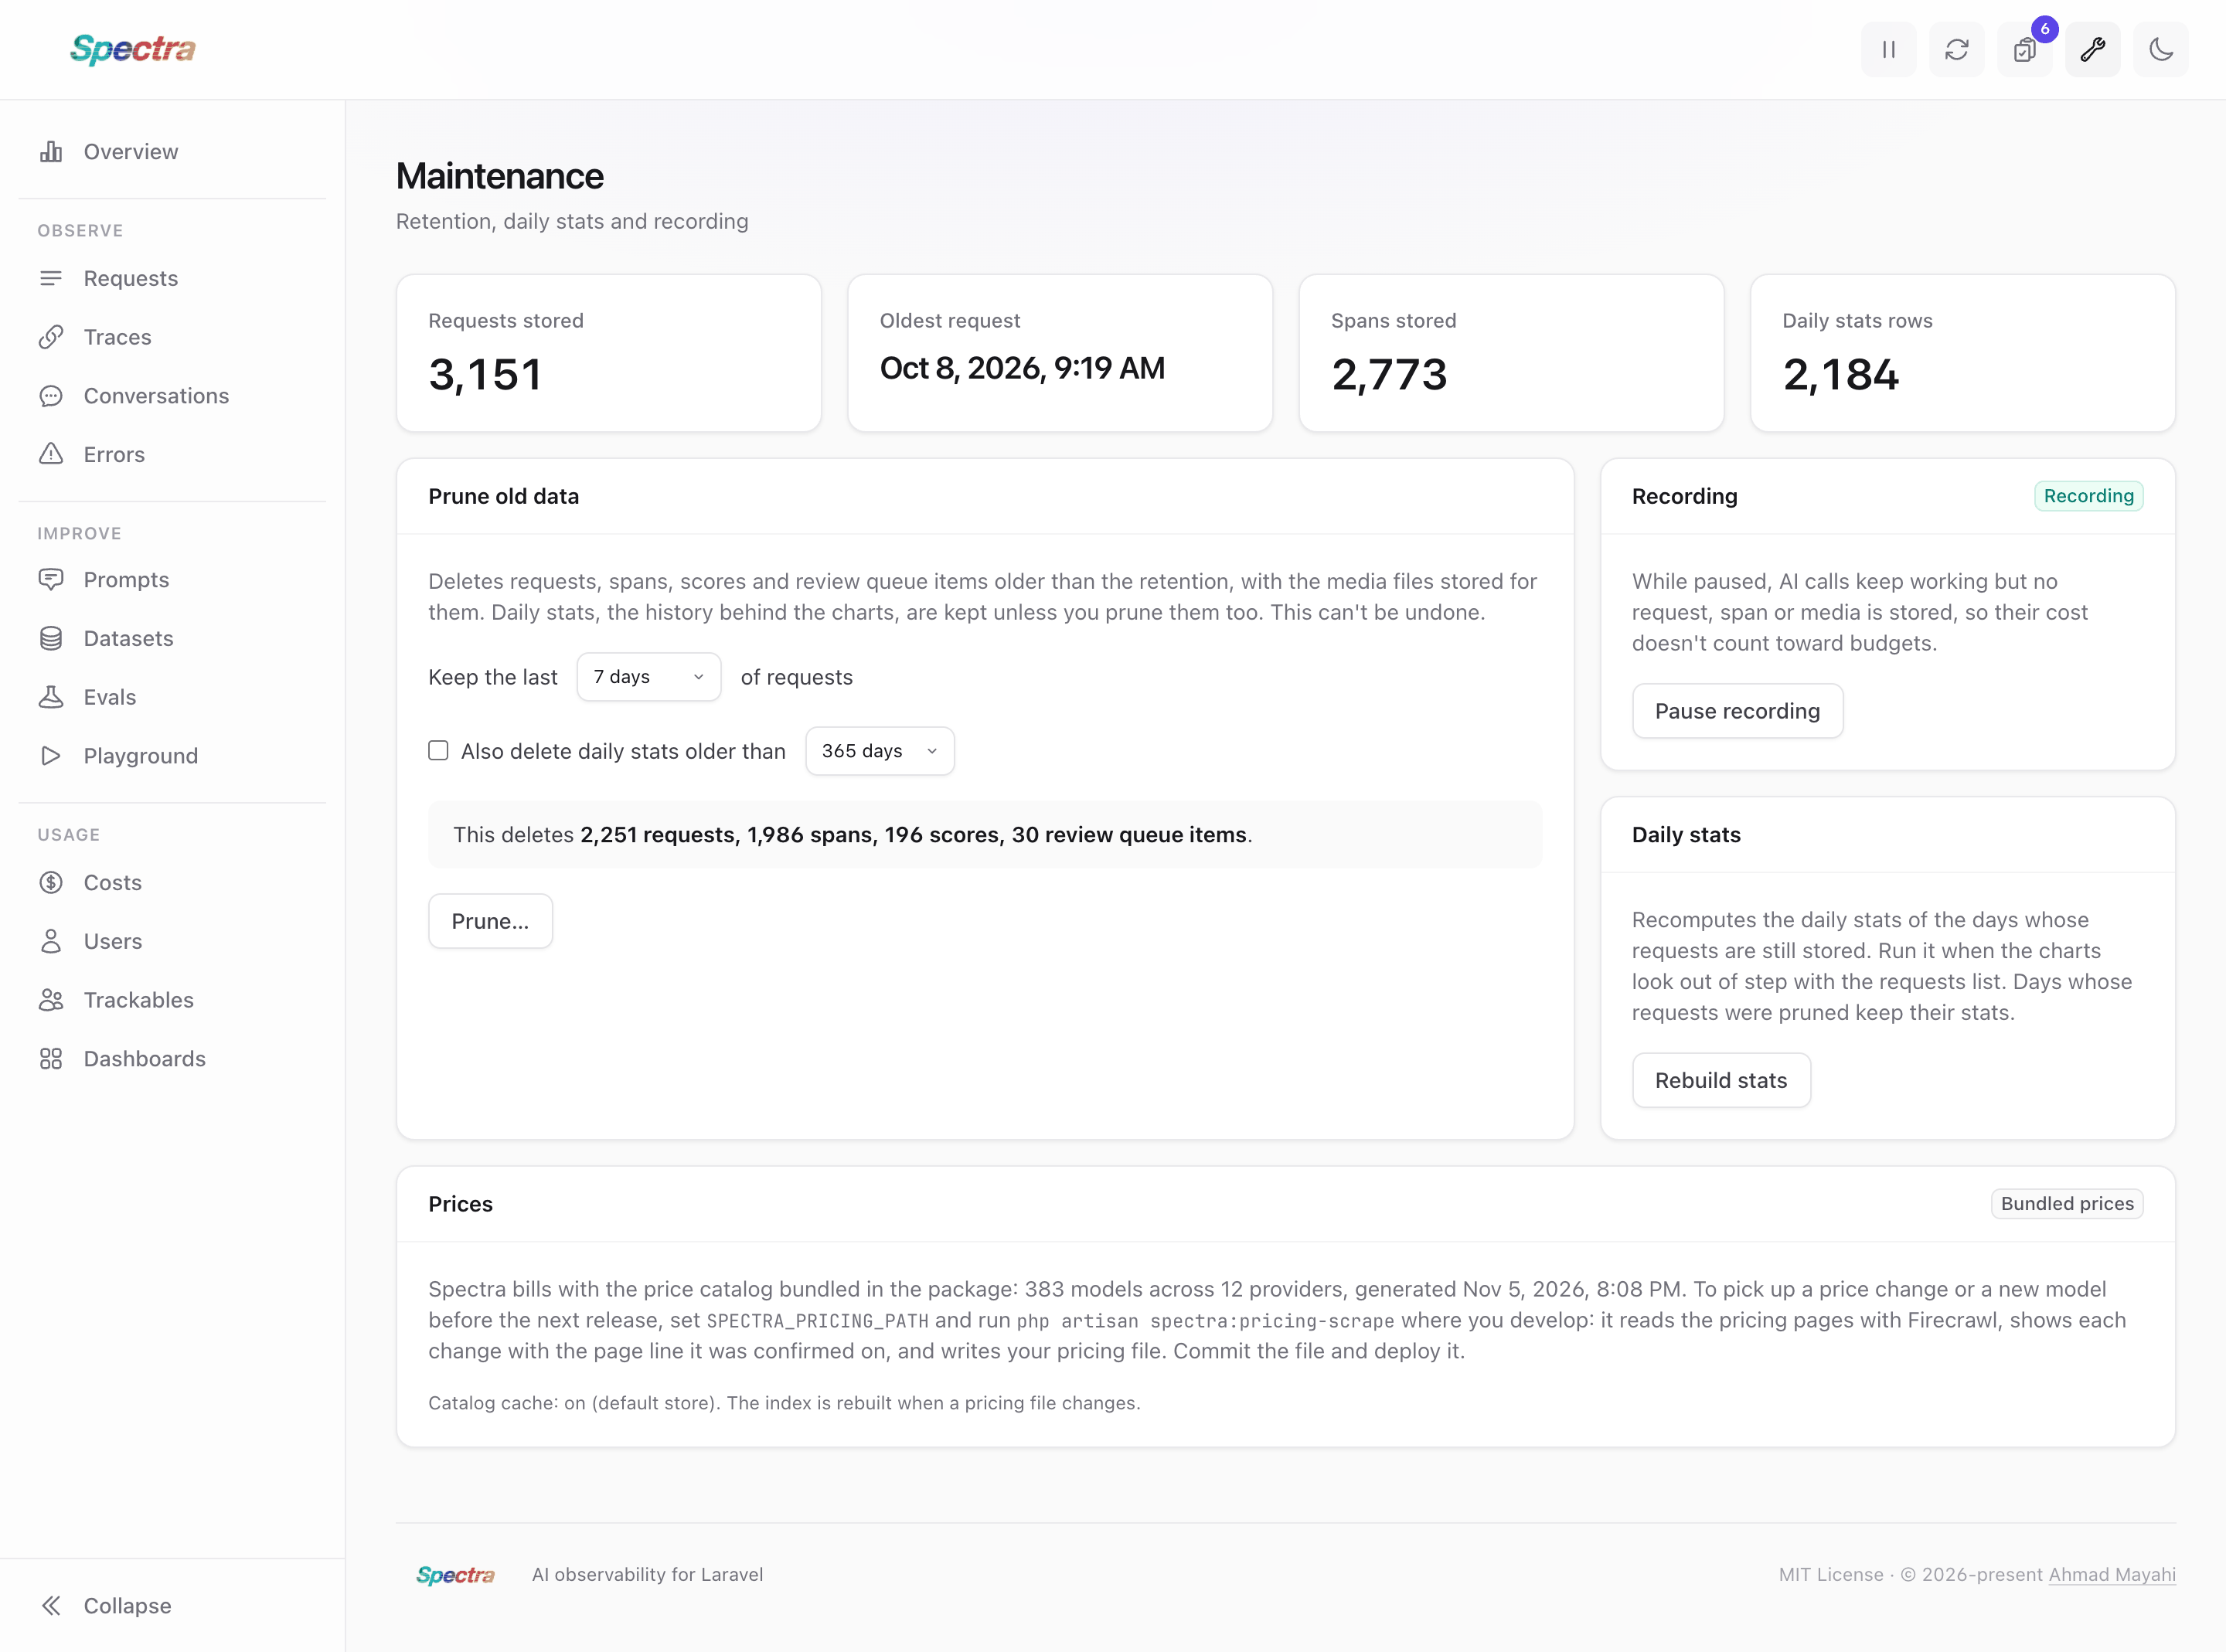
The wrench icon in the top bar opens the Maintenance screen. It shows how many requests, spans and daily stats are stored and when the oldest request was made, and it runs the upkeep that is otherwise on the command line:
- Prune old data. Pick how much to keep (24 hours to 1 year) and, optionally, how many days of daily stats to keep. The screen counts what would be deleted before you confirm. It runs
spectra:pruneon the queue. - Pause recording. While paused, AI calls keep working but nothing is stored, so their cost doesn't count toward budgets. Same as
spectra:pause. - Rebuild stats. Recomputes the daily stats of the days whose requests are still stored, on the queue. Days whose requests were pruned keep their stats.
- Prices. Read-only: the bundled catalog (when it was generated, how many models), your own pricing file when
SPECTRA_PRICING_PATHis set (whether it exists and how many models it holds per provider), and whether the pricing cache is on. The dashboard runs in production, so it never checks or changes prices. Runspectra:pricing-scrapewhere you develop, review its changes, then commit the file and deploy it.
Prunes and rebuilds run as queued jobs on Spectra's queue connection (queue.connection and queue.queue), one of each at a time, and the screen refreshes while one is queued. Without a queue worker they wait in the queue; with the sync driver they run during the request.
Anyone who can open the dashboard sees this screen. Running its actions also needs the manageSpectra gate, which allows only the local environment unless you define it (see Dashboard Authorization). Set dashboard.maintenance to false to keep these actions on the command line. The pause flag and the last runs are kept in your default cache store.
Prices
Every price on the dashboard uses the same format: two decimals from $1 ($1,234.56), four decimals below $1 ($0.0579, $0.0007), and <$0.0001 for anything smaller. Hover a rounded price to see the exact amount ($0.00000544). Spectra stores costs with more precision than it shows; see Costs.
Dark Mode
The dashboard follows your system theme. The moon and sun icon in the top bar switches it, and the dashboard remembers your choice in the browser.
Trying It With Demo Data
To try the dashboard without sending any AI requests, clone the repository and build the workbench. It seeds a month of traffic across 9 providers and 8 users, recorded through the real tracking pipeline:
composer install
vendor/bin/testbench workbench:build
vendor/bin/testbench serve
Then open http://localhost:8000/spectra. The demo's Playground is on and answers from a fake provider, so trying it needs no API key and costs nothing. To see a failed run, use a model name with does-not-exist in it. Shared dashboards are on too: open /workbench/view-as/2 to log in as a user and open a shared dashboard's link as its viewer.