
Shared Dashboards
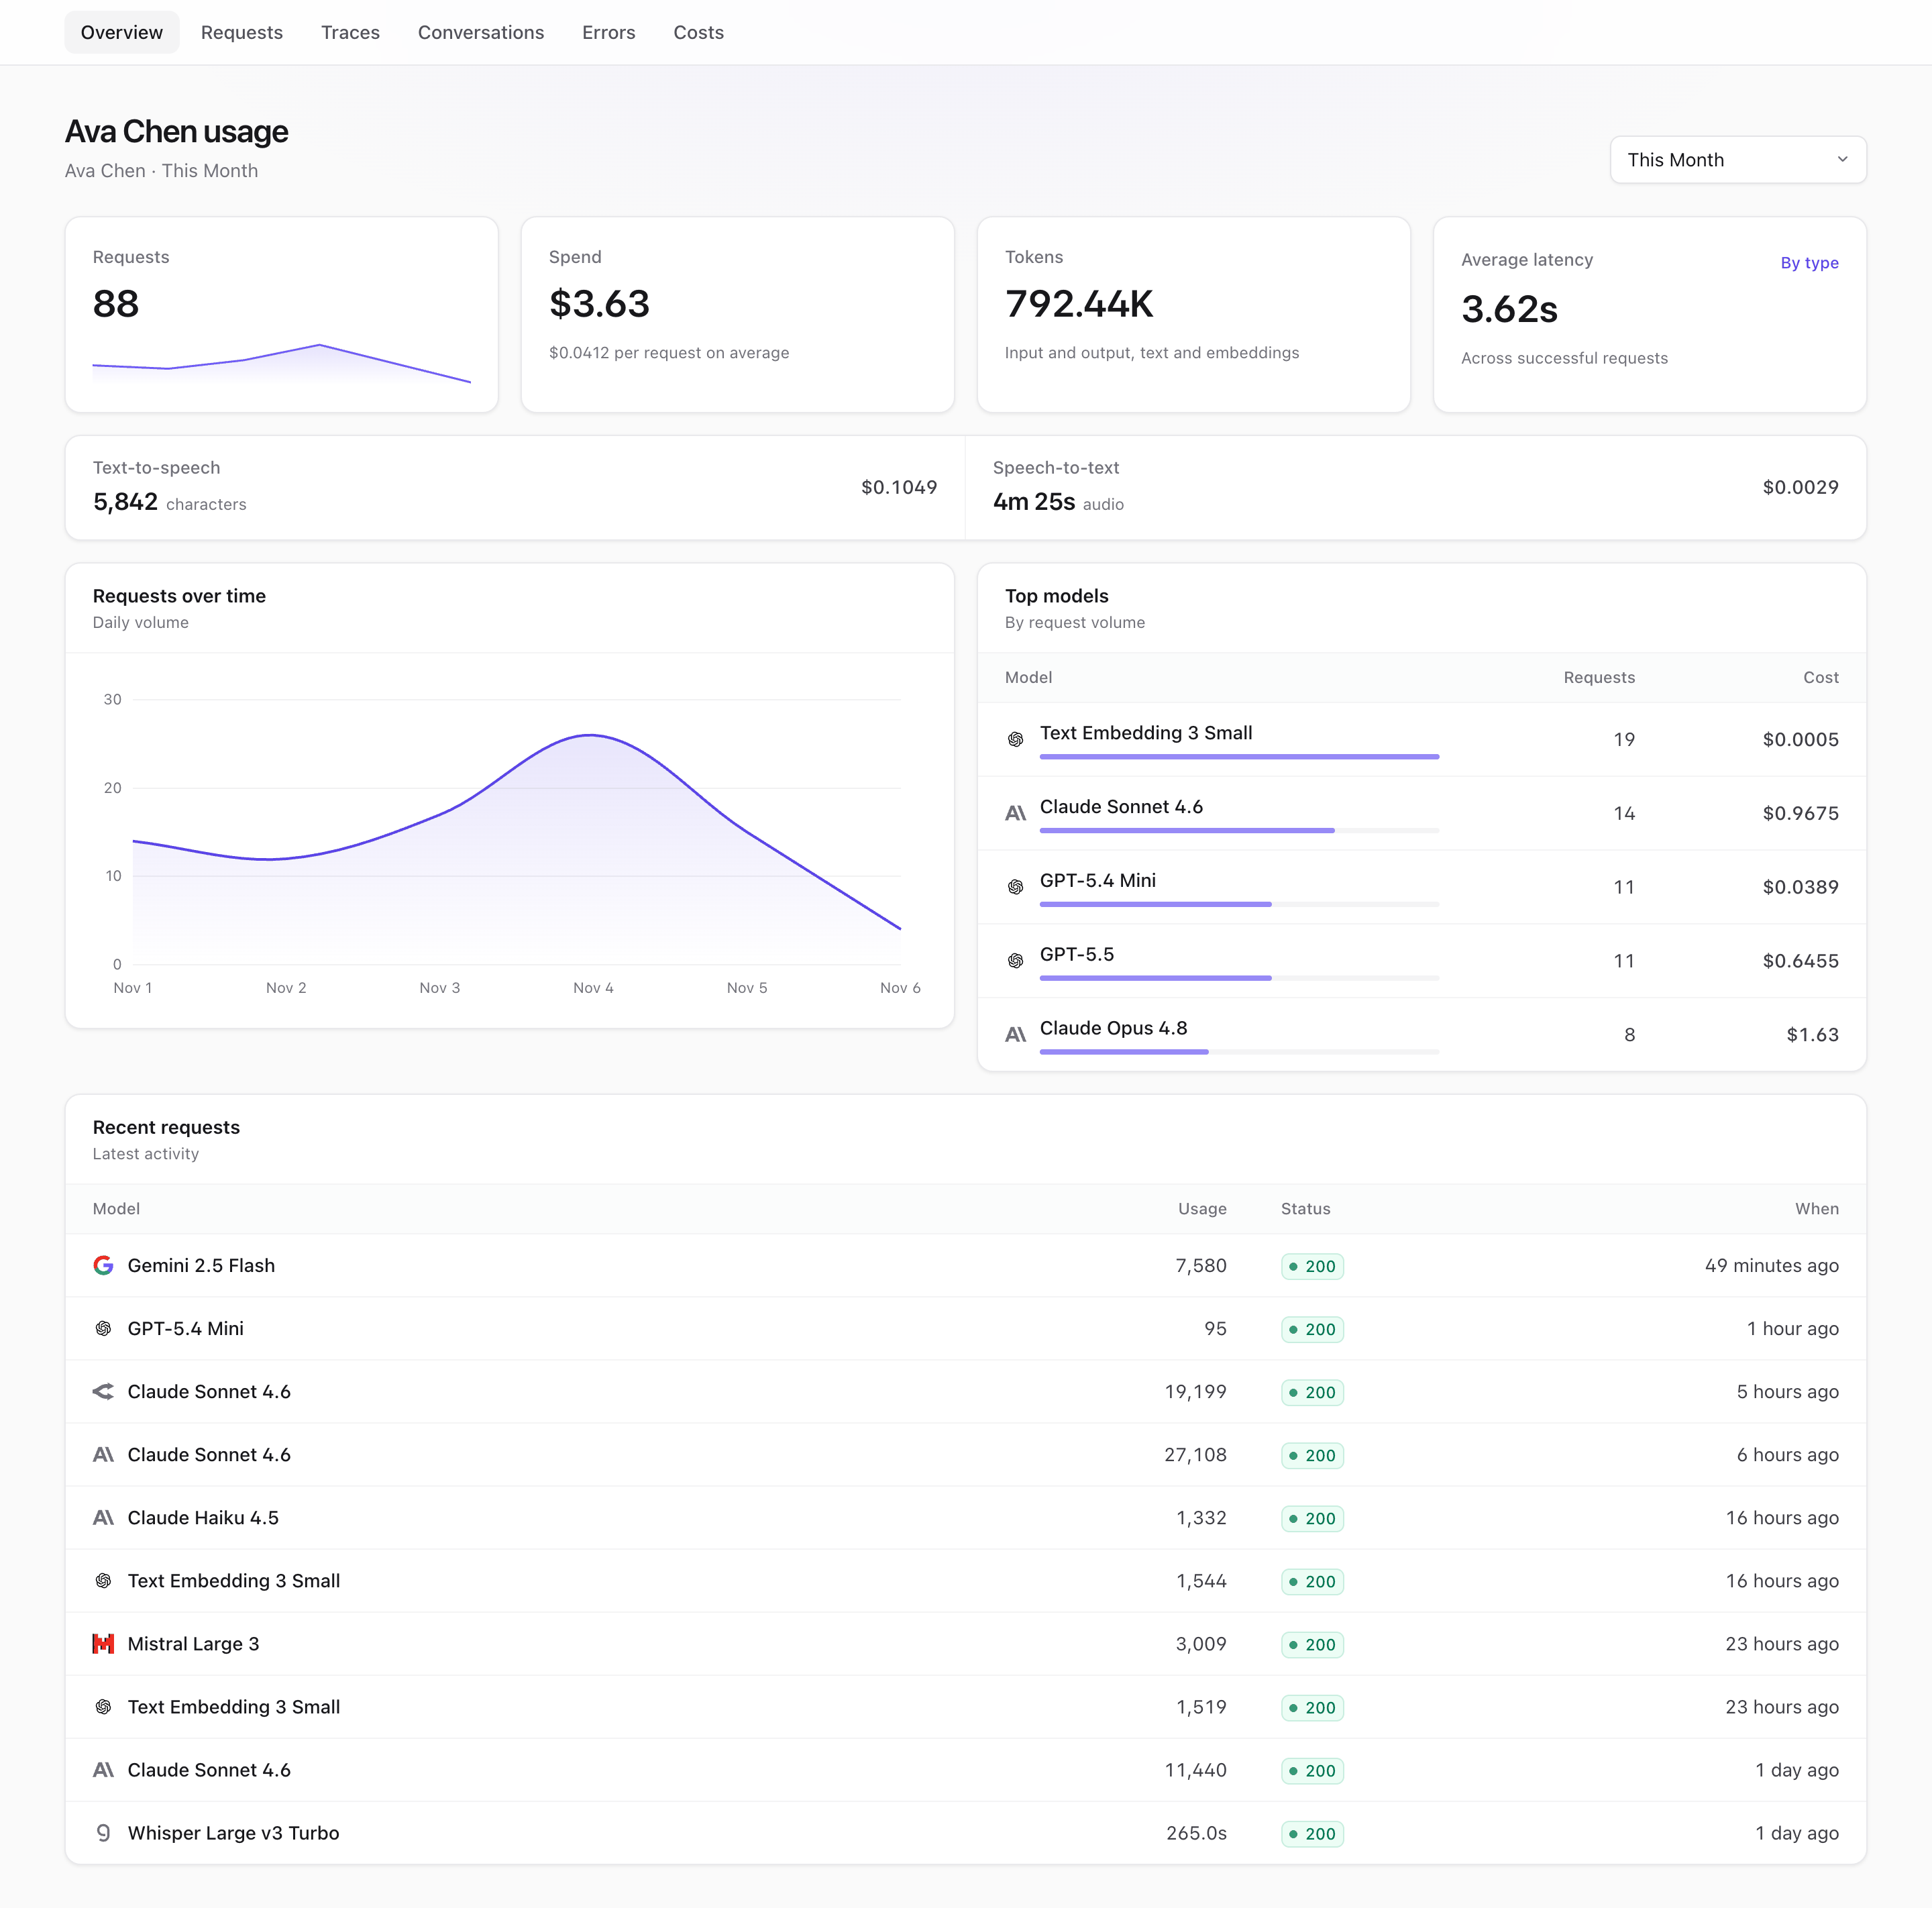
A customer asks how much AI usage their account has had this month. Spectra knows, but its dashboard shows everyone's data, so you can't give them access to it. A shared dashboard solves that: you design a small read-only page, choose whose data it shows, and give that person the link. They log in to your app as usual and see only their own numbers.
What Is a Shared Dashboard?
A shared dashboard is a saved page with two parts: the widgets it shows, such as total requests and the latest calls, and the trackable it shows them for. A trackable is any model you attribute AI calls to, such as a User or a Team.
A shared dashboard is always for one trackable. For example, you might:
- Make one page for your biggest customer, showing their spend and budget.
- Create one for each customer when they sign up, and link to it from your app's account settings.
- Give a team lead a page for their
Team, without giving them Spectra's own dashboard.
This is separate from Spectra's own dashboard, the admin screens at /spectra. Viewers of a shared dashboard can't open those, and don't need to. Inside Spectra, you'll find shared dashboards under Dashboards in the sidebar.
Turning Them On
Shared dashboards give people who can't open Spectra's own dashboard access to data, so they are off until you turn them on. Add this to your .env:
SPECTRA_DASHBOARDS_ENABLED=trueThen run the installer, which publishes and runs the migration:
php artisan spectra:installDesigning a shared dashboard needs the manageSpectra gate, which allows only the local environment until you define it:
Gate::define('manageSpectra', fn ($user) => $user->isAdmin());Creating a Shared Dashboard
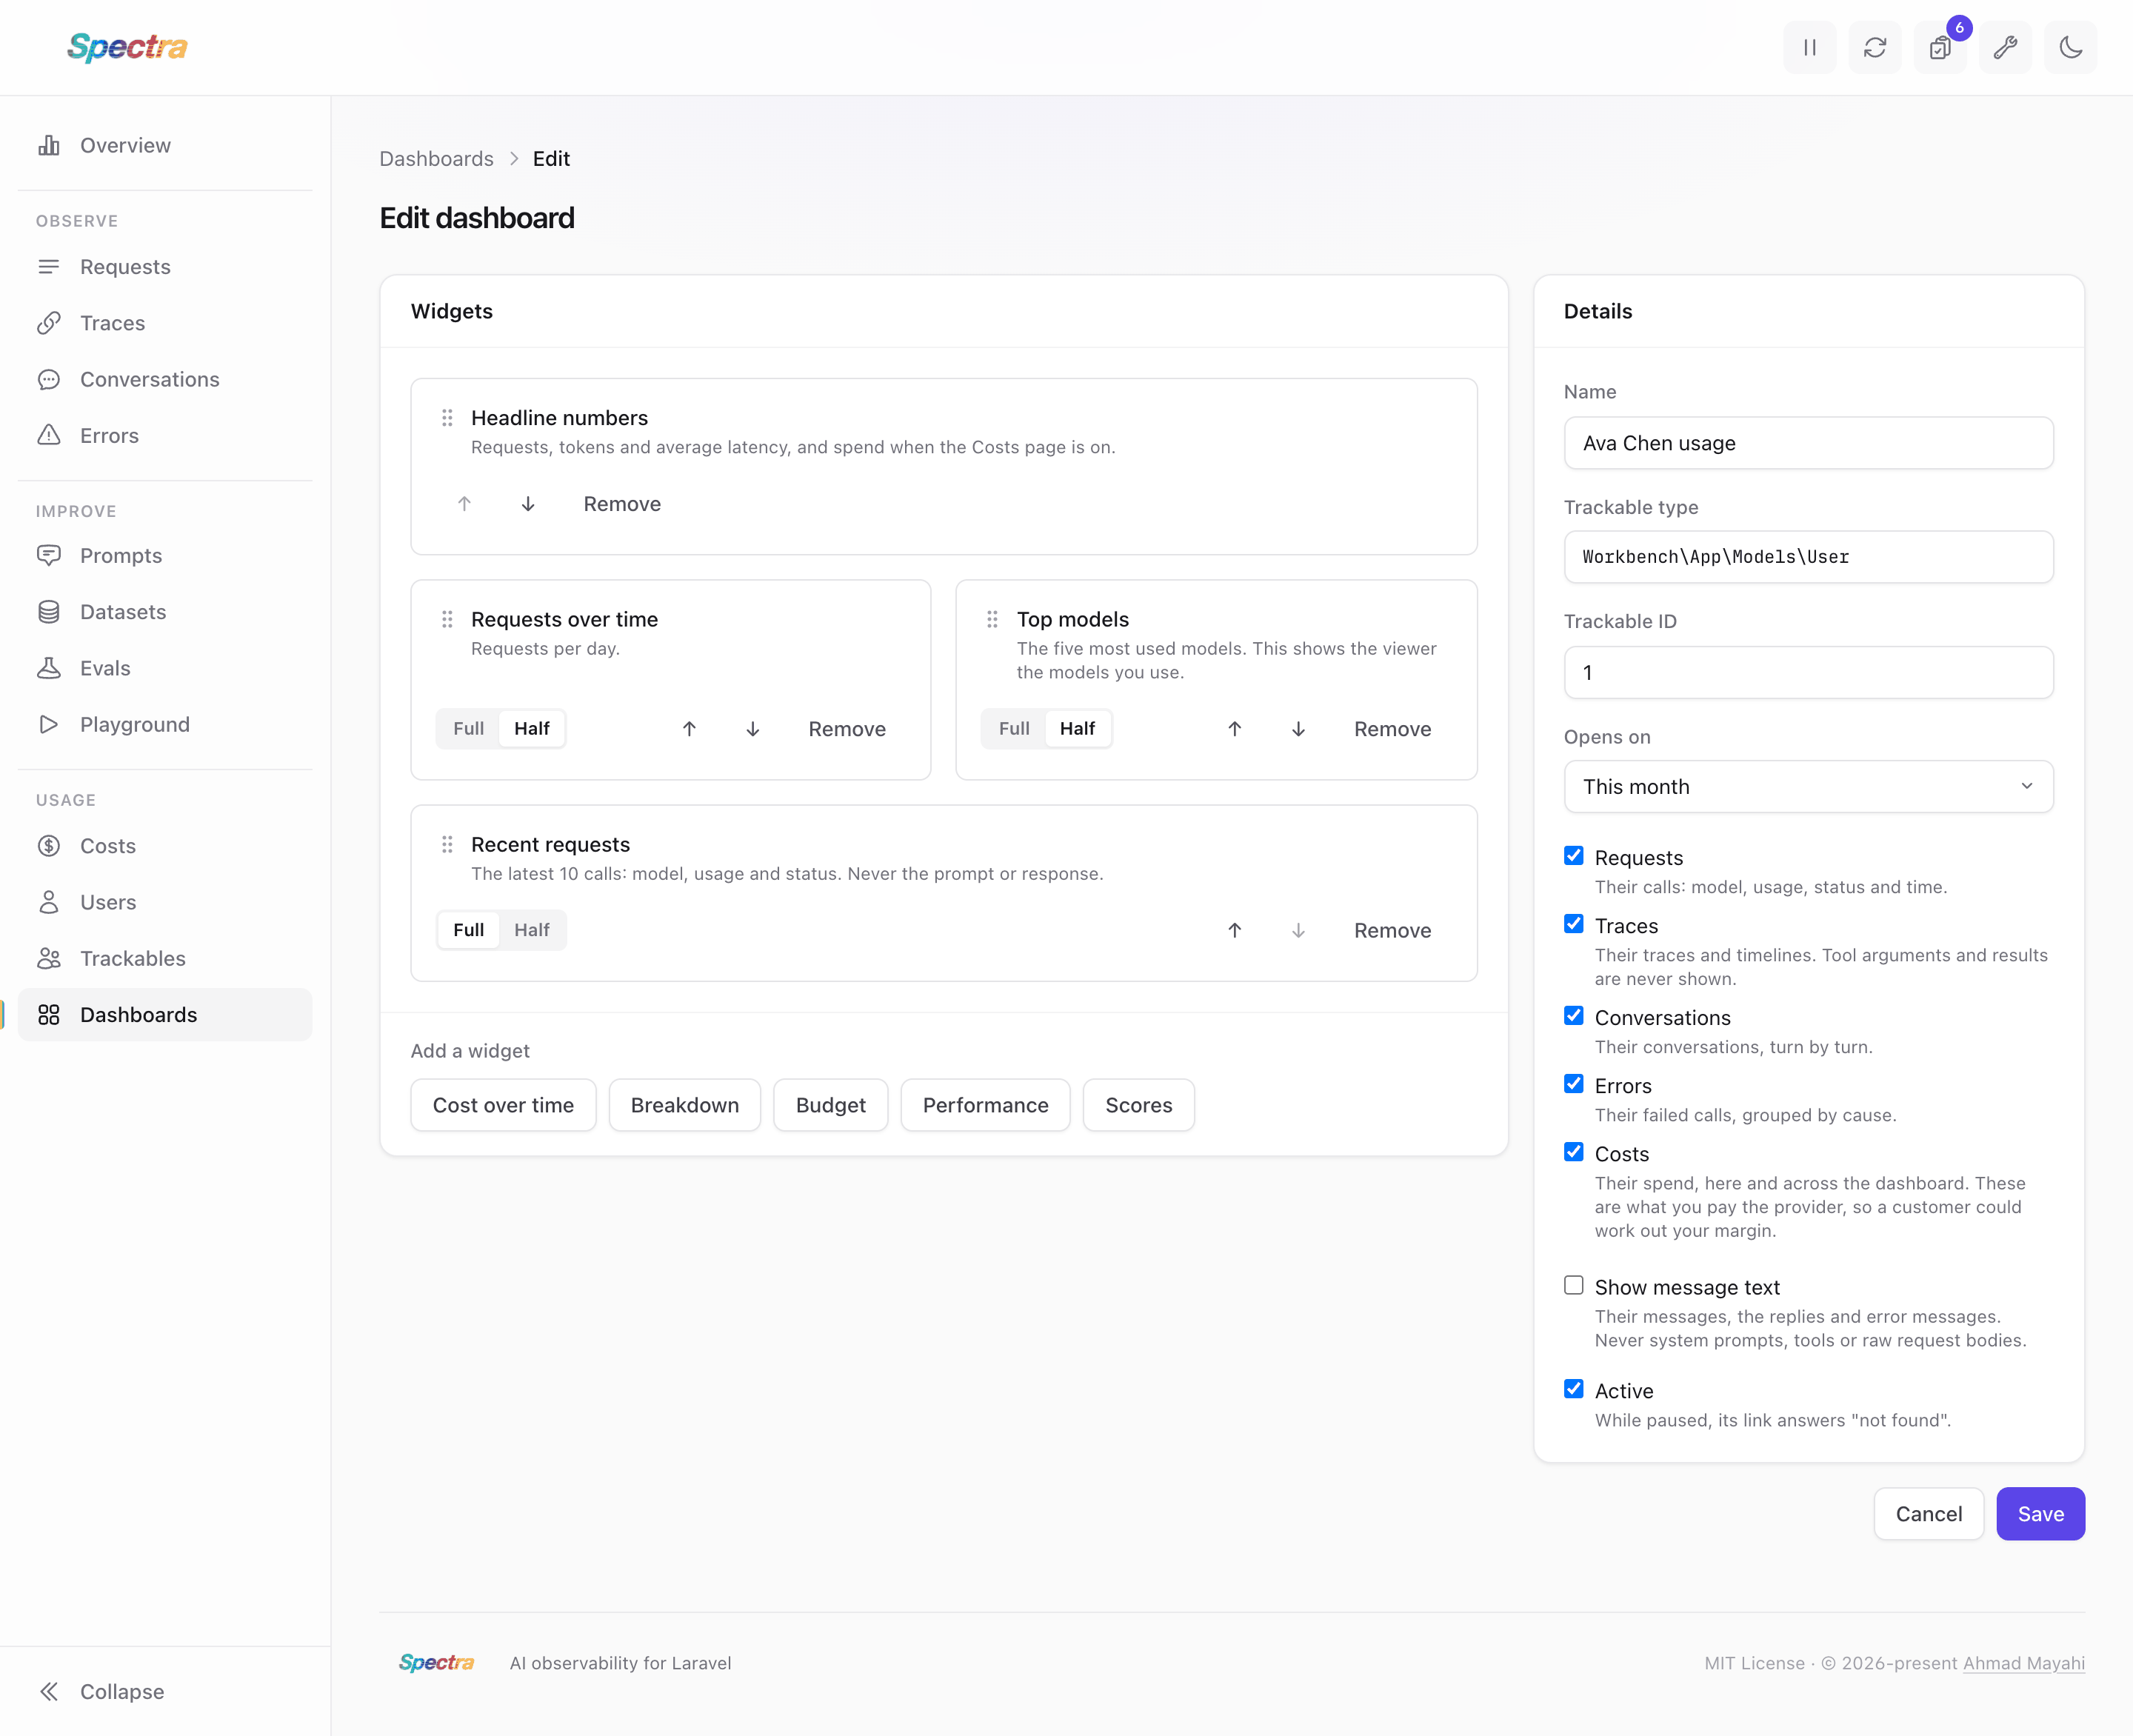
Open Dashboards in Spectra's sidebar and press New dashboard. Name it, choose who can see it, and drag the widgets you want into place, or click one to add it at the end. The widgets sit in the same layout your viewers get, and each can take the full width or half of it. Share a dashboard on a trackable's page starts one for that trackable.
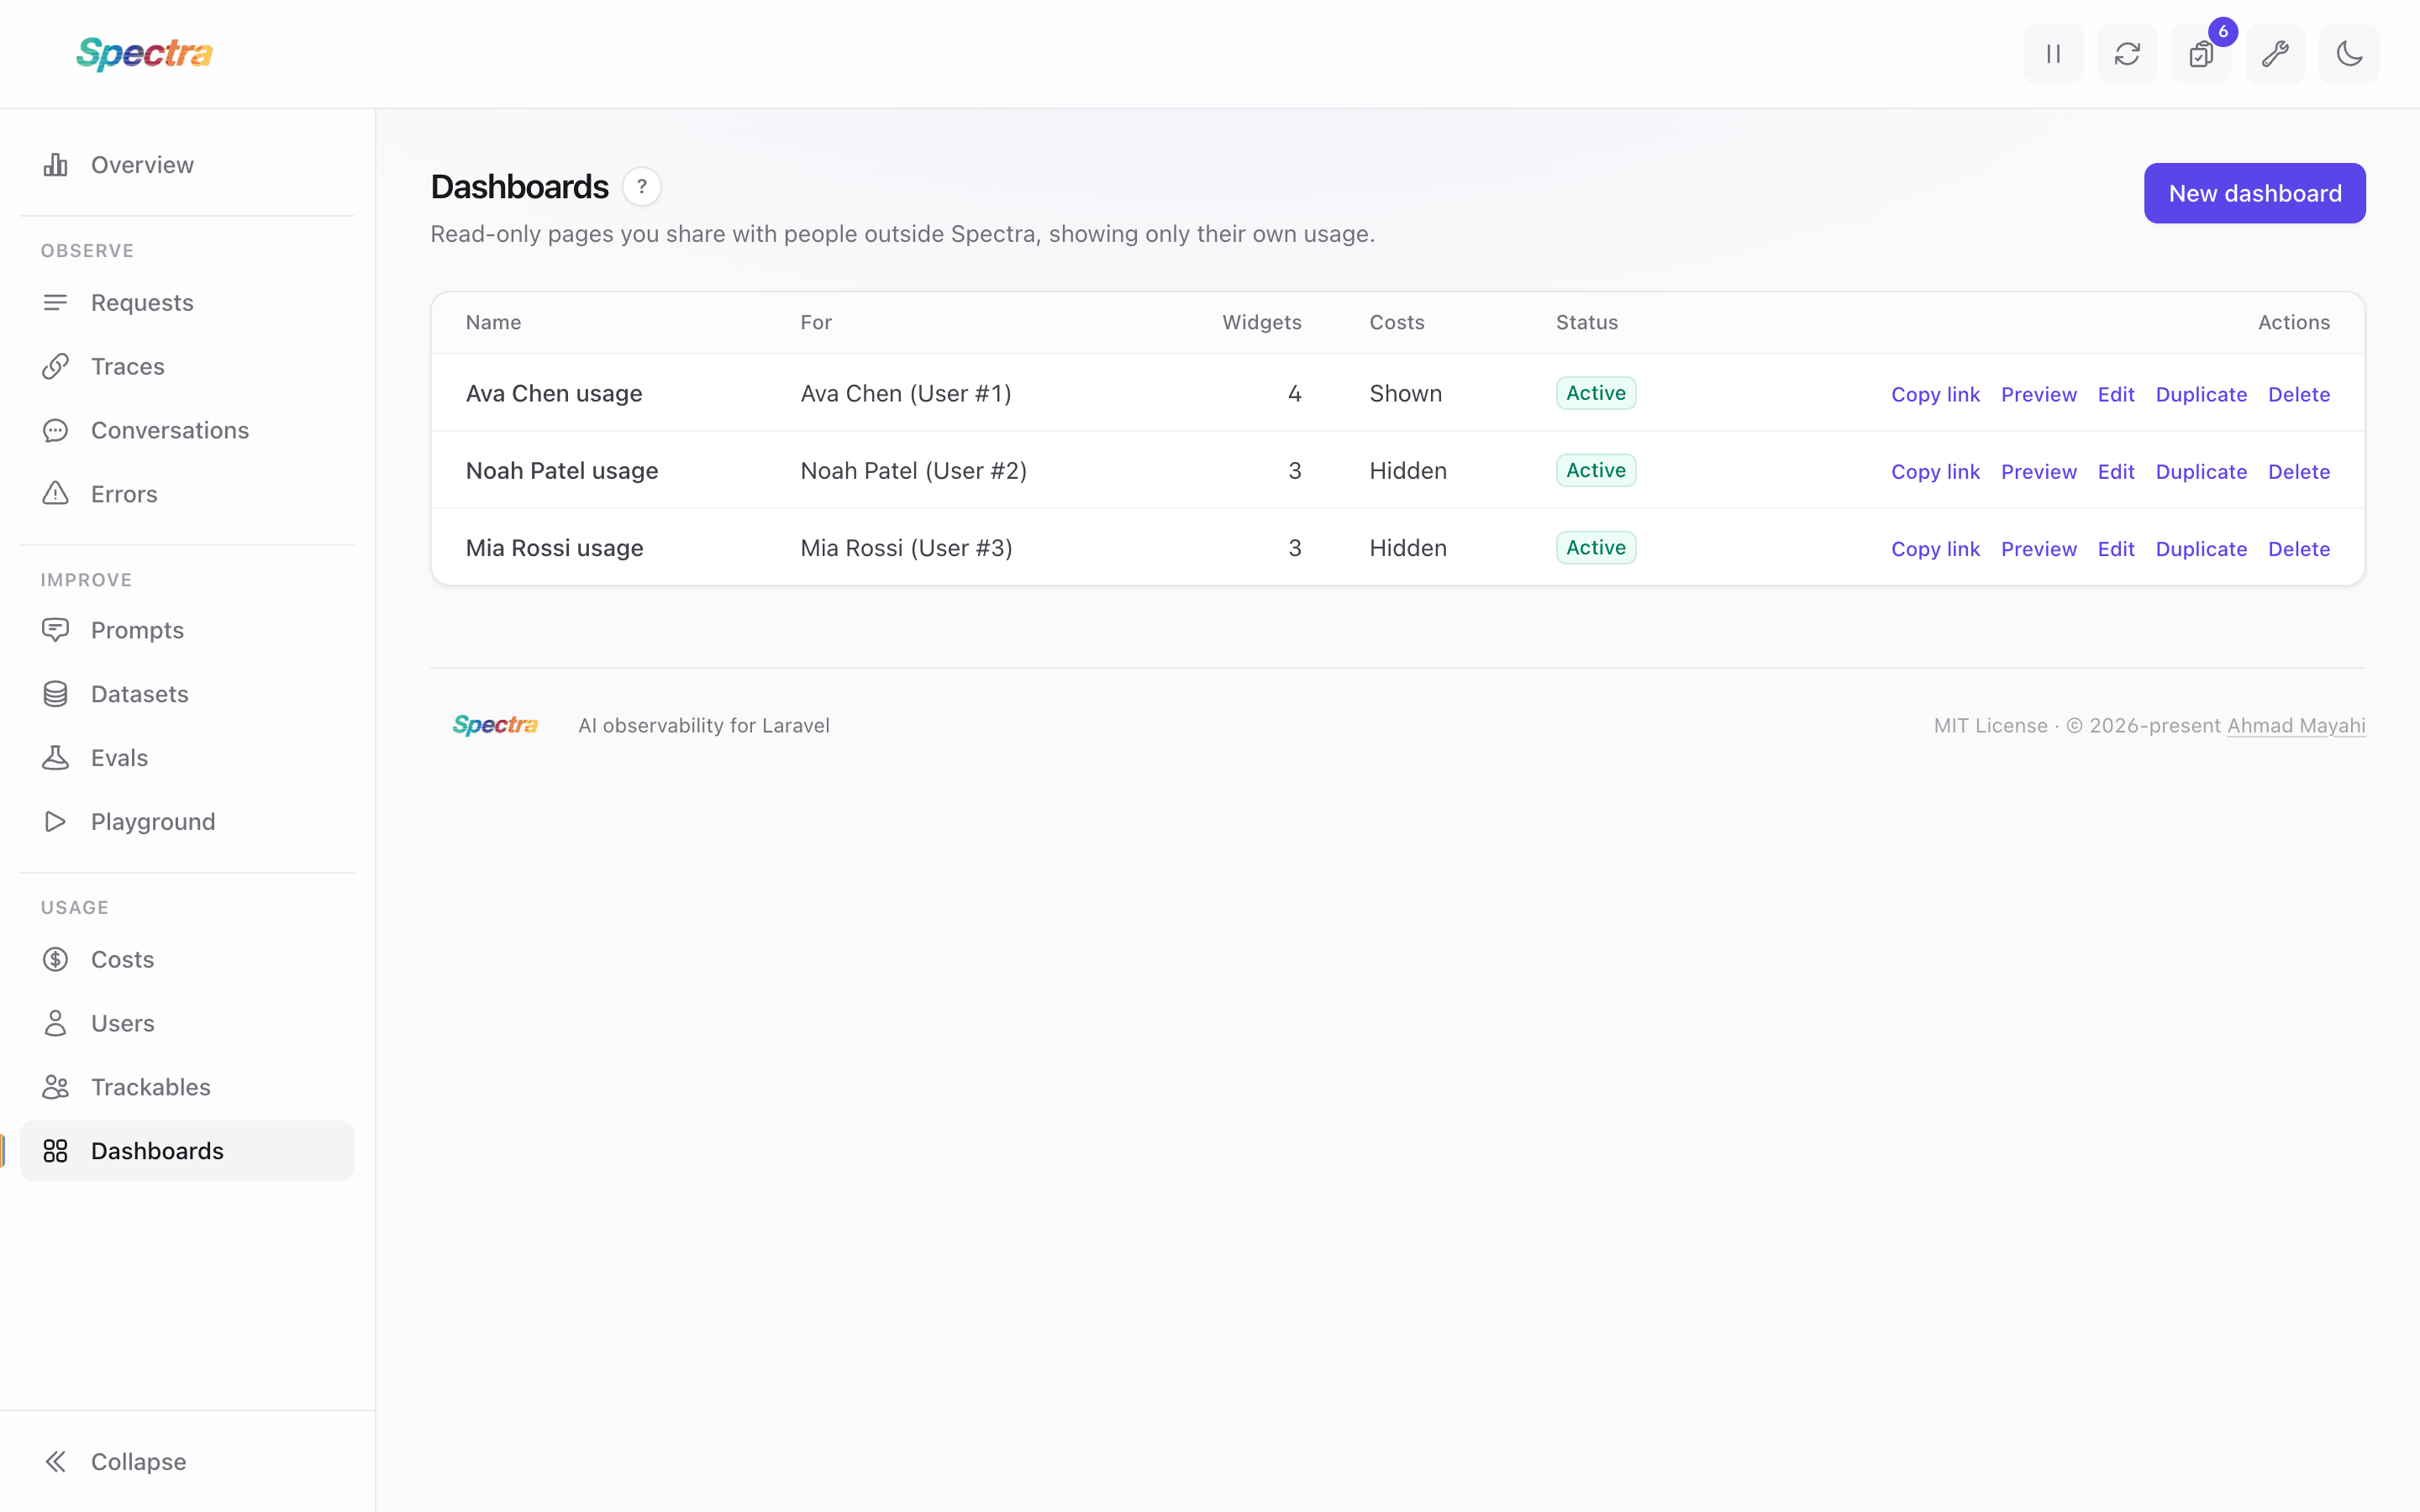
The Dashboards screen lists what you've made. Preview shows exactly what the viewer gets, and Copy link gives you the URL to send them.
From Code
You can do the same with Spectra::dashboard(), for example when a customer signs up:
use Spectra\Facades\Spectra;

// For one user. Pass a model...
$dashboard = Spectra::dashboard()->create('Usage', $user);

// ...or a type and an id.
Spectra::dashboard()->create('Usage', User::class, trackableId: 123);


// The link to give them.
$dashboard->url();
Choose the widgets, and how the page starts, with named arguments:
Spectra::dashboard()->create(
    'Acme usage',
    $team,
    widgets: ['stats', ['type' => 'budget', 'size' => 'half'], ['type' => 'usage_by_model', 'size' => 'half']],
    period: 'week',
    sections: ['costs'],
);
Without widgets, a shared dashboard shows the headline numbers, requests over time and recent requests. The name and the trackable identify a shared dashboard, so creating the same one again changes it and keeps its link. That makes it safe to call from a seeder or a deploy script. A wrong argument throws an InvalidArgumentException.
To find and delete shared dashboards:
// Every shared dashboard.
Spectra::dashboard()->list();

// The ones for this user.
Spectra::dashboard()->list($user);

// Every shared dashboard for a type.
Spectra::dashboard()->list(User::class);

// By the model or its id. Returns whether one was deleted.
Spectra::dashboard()->delete($dashboard);
list() includes paused shared dashboards, so check is_active before you link to one. Deleting a shared dashboard ends its link. The calls it showed stay stored.
Widgets
| Widget | Shows |
|---|---|
stats | Requests with a daily trend, tokens, average latency and any media usage, plus spend when the Costs page is on |
requests_trend | Requests per day |
cost_trend | Spend per day. Left out unless the Costs page is on |
usage_by_model | The five most used models, plus cost when the Costs page is on |
usage_by_provider | The share of requests by provider and by model type |
recent_requests | The latest 10 calls: model, usage, status and time |
budget | Usage against the trackable's budget limits. Cost limits show only when the Costs page is on |
performance | Error rate and latency percentiles per model |
scores | Scores on the trackable's calls, traces and conversations, by name. Comments are never sent |
They're the same widgets as the Overview in Spectra's own dashboard, narrowed to the trackable. The Overview's alerts aren't offered, because alert rules cover your whole app. Each widget is full or half width. Viewers can switch the page between today, this week, this month and this year. The budget widget uses each limit's own period instead.
What Viewers See
A shared dashboard shows totals and a short list of calls, and nothing a viewer could use to read your prompts:
- System prompts, tools and raw request bodies are never sent, and neither are metadata, origins or tool arguments and results, whichever widgets and pages you choose.
- Message text is hidden unless you turn it on. With Show message text, viewers can read their own messages, the replies and error messages. Without it, they see only the numbers.
- Costs are hidden until you turn on the Costs page. They are what you pay the provider, so a customer could work out your margin. Without it, the server doesn't send them at all.
- Model and provider names are shown by
usage_by_model,usage_by_provider,recent_requestsandperformance. Leave those widgets out if you'd rather not say which ones you use. - Score names are shown by
scores. Names likehallucinationor a reviewer's label can be internal, so check yours before adding this widget.
Pages
Besides its widgets, a shared dashboard can link to more pages in a header, each showing only that viewer's data. They are off until you turn them on, and with none on there is no header:
| Page | Shows |
|---|---|
requests | Their calls: model, usage, status and time |
traces | Their traces, with a timeline of each |
conversations | Their conversations, turn by turn |
errors | Their failed calls, grouped by cause |
costs | Their spend over time, by provider and by model. Also shows costs in the widgets and on the other pages |
Choose them on the dashboard's form, or in code:
Spectra::dashboard()->create(
    'Usage',
    $user,
    sections: ['requests', 'traces', 'errors'],
    showMessages: true,
);
A trace or a conversation can hold calls from more than one trackable, so a viewer sees one only when every call in it is theirs. Anything mixed or partly unattributed stays hidden from everyone involved.
These pages run on their own endpoints under /spectra/dashboards/{id}, and viewers never reach the API of Spectra's own dashboard.
Who Can Open a Shared Dashboard
Spectra has no login of its own. Viewers log in through your app:
- They open the link. If they aren't logged in, your app's
authmiddleware sends them to your login page. - After logging in, your app sends them back. Your login must redirect with
redirect()->intended(), as Laravel's starter kits do. - Spectra checks that the logged-in user is the shared dashboard's trackable. Anyone else gets a 403, so forwarding the link gives nobody access.
Pausing a shared dashboard makes its link answer 404 until you turn it back on.
Teams and Other Trackables
By default, a viewer must be the trackable themselves. When your trackable is something else, such as a Team, tell Spectra who counts by binding your own DashboardTrackableResolver:
use Illuminate\Contracts\Auth\Authenticatable;
use Illuminate\Database\Eloquent\Model;
use Spectra\Contracts\DashboardTrackableResolver;

class TeamDashboards implements DashboardTrackableResolver
{
    public function resolve(Authenticatable $viewer, string $type, string $id): ?Model
    {
        // The viewer must belong to the team the dashboard is for.
        return $viewer->teams()->find($id);
    }
}$this->app->bind(DashboardTrackableResolver::class, TeamDashboards::class);Return the trackable the viewer may see, or null to refuse them. Spectra also checks that what you return is what the shared dashboard is for.
The Pages' Middleware
Viewers' pages have their own middleware, so restricting Spectra's own dashboard doesn't block them. If your customers log in on another guard, name it, and use domain to serve the pages on another domain (see Configuration):
'dashboards' => [
    'enabled' => env('SPECTRA_DASHBOARDS_ENABLED', false),
    'middleware' => ['web', 'auth:customer', 'throttle:60,1'],
    'domain' => env('SPECTRA_DASHBOARDS_DOMAIN'),
],
Testing
Under Spectra::fake(), shared dashboards are kept in memory, so your tests need no migrations. Arguments are checked as they are for the real thing:
$fake = Spectra::fake();

$dashboard = Spectra::dashboard()->create('Usage', $user);

$fake->assertDashboardCreated('Usage');

Spectra::dashboard()->delete($dashboard);

$fake->assertDashboardDeleted($dashboard->id);